
Quick answer
To read a Google algorithm tracker as of October 29, 2026, count how many days stay high instead of staring at the peak. Semrush Sensor rates 5-8 as high and 8-10 as very high on its 0-10 scale. Our rule calls 3 or more high days in a row sustained, so check Google's Search Status Dashboard and your own Search Console clicks before you change a page.
A forum thread blames a Google update for this week's ranking wobble, and the only evidence posted is a red chart from a tracker. A Google algorithm tracker is a public chart that scores how much Google's results moved for a fixed set of keywords since the day before. It helps an owner or in-house marketer, as long as you know what it can't say about your own site.
First up: what a tracker measures, then four trackers compared side by side, with their scales mapped onto weather words. Next, why trackers flag updates Google never confirms, and how to tell a spike from sustained change. Then niche and device views, our test on made-up example series and what it showed. Last come a cross-check against Google's own sources and a weekly routine.
Key takeaways
- Count high days in a row; a single peak proves little.
- Semrush Sensor calls 5-8 high and 8-10 very high on its scale.
- Google says it might ship dozens of small updates in one week.
- In our example test, the tallest one-day spike stayed a spike.
- Confirm on Google's Search Status Dashboard, then in your own Search Console.
What a Google algorithm tracker measures, and what it can't
The four trackers in this guide work the same basic way. Each one checks the same keywords every day, records which pages rank and turns the overnight reshuffle into one number.
Moz's MozCast explainer says it tracks 10,000 hand-picked keywords across 20 industry categories and 5 major US cities, and compares page one of Google's organic results with the day before.
That design tells you what the number can mean. A high reading says many results in the tracker's sample moved overnight. It doesn't say your pages moved. It doesn't say why anything moved, or whether Google changed something on purpose or the web simply changed underneath it. Your keywords may sit outside that sample entirely, especially if you serve one city, sell one product line or work in a narrow trade such as commercial roofing. MozCast's sample, for instance, covers 5 major US cities, so a rural service area may not be in it at all. A one-van plumber and a national software brand can watch the same tracker and have completely different weeks.
Google itself says search results are dynamic in nature because the open web keeps changing. Some movement shows up every day, update or not.
So treat a tracker as a thermometer for Google's results as a whole. Your own ranking report measures your site, and you can build one yourself with our DIY SEO audit and rank tracking guide, no agency needed.
Four trackers, four ways to score a day
Beyond that shared method, trackers differ in three choices: the keyword sample, the formula and the views you can switch. Each choice moves the number. Here is what each vendor says on its own explainer page, read on October 29, 2026:
| Tracker | What it samples | How it scores a day | Views you can switch |
|---|---|---|---|
| MozCast (Moz) | 10,000 hand-picked keywords, 20 industry categories, 5 major US cities, page one | A temperature; about 70°F is an uneventful day, hotter means more change | SERP feature graph, 90-day history |
| Semrush Sensor | A fixed keyword set in 20+ categories | A 0-10 score from a formula Semrush keeps private | Categories, desktop vs mobile, US and 8 other databases |
| Google Grump (AccuRanker) | About 1,000,000 high-volume keywords, top 30 results | Average rank change per result against the day before | Country and device |
| Algoroo (DEJAN) | Carefully selected keywords | Up and down moves added into one "roo" number | google.com or google.com.au, desktop or mobile |
Only two trackers publish a count, and they're a factor of 100 apart (1,000,000 ÷ 10,000): MozCast's 10,000 keywords against the roughly 1,000,000 that AccuRanker describes for Grump. Grump also reads 30 results per keyword, not just page one.
Formulas differ, too. Algoroo adds positive and negative moves together into a single number it calls roo, so a 7 on one tool and a 7 on another aren't the same 7.
Agreement between tools is the better signal. When three of these lines rise on the same days, the move is probably broad, and when only one rises, it may be that tool's sample. Our Mangools guide names a SERP Volatility checker among Mangools' free mini tools, and our free SEO tools guide sorts other options by job.
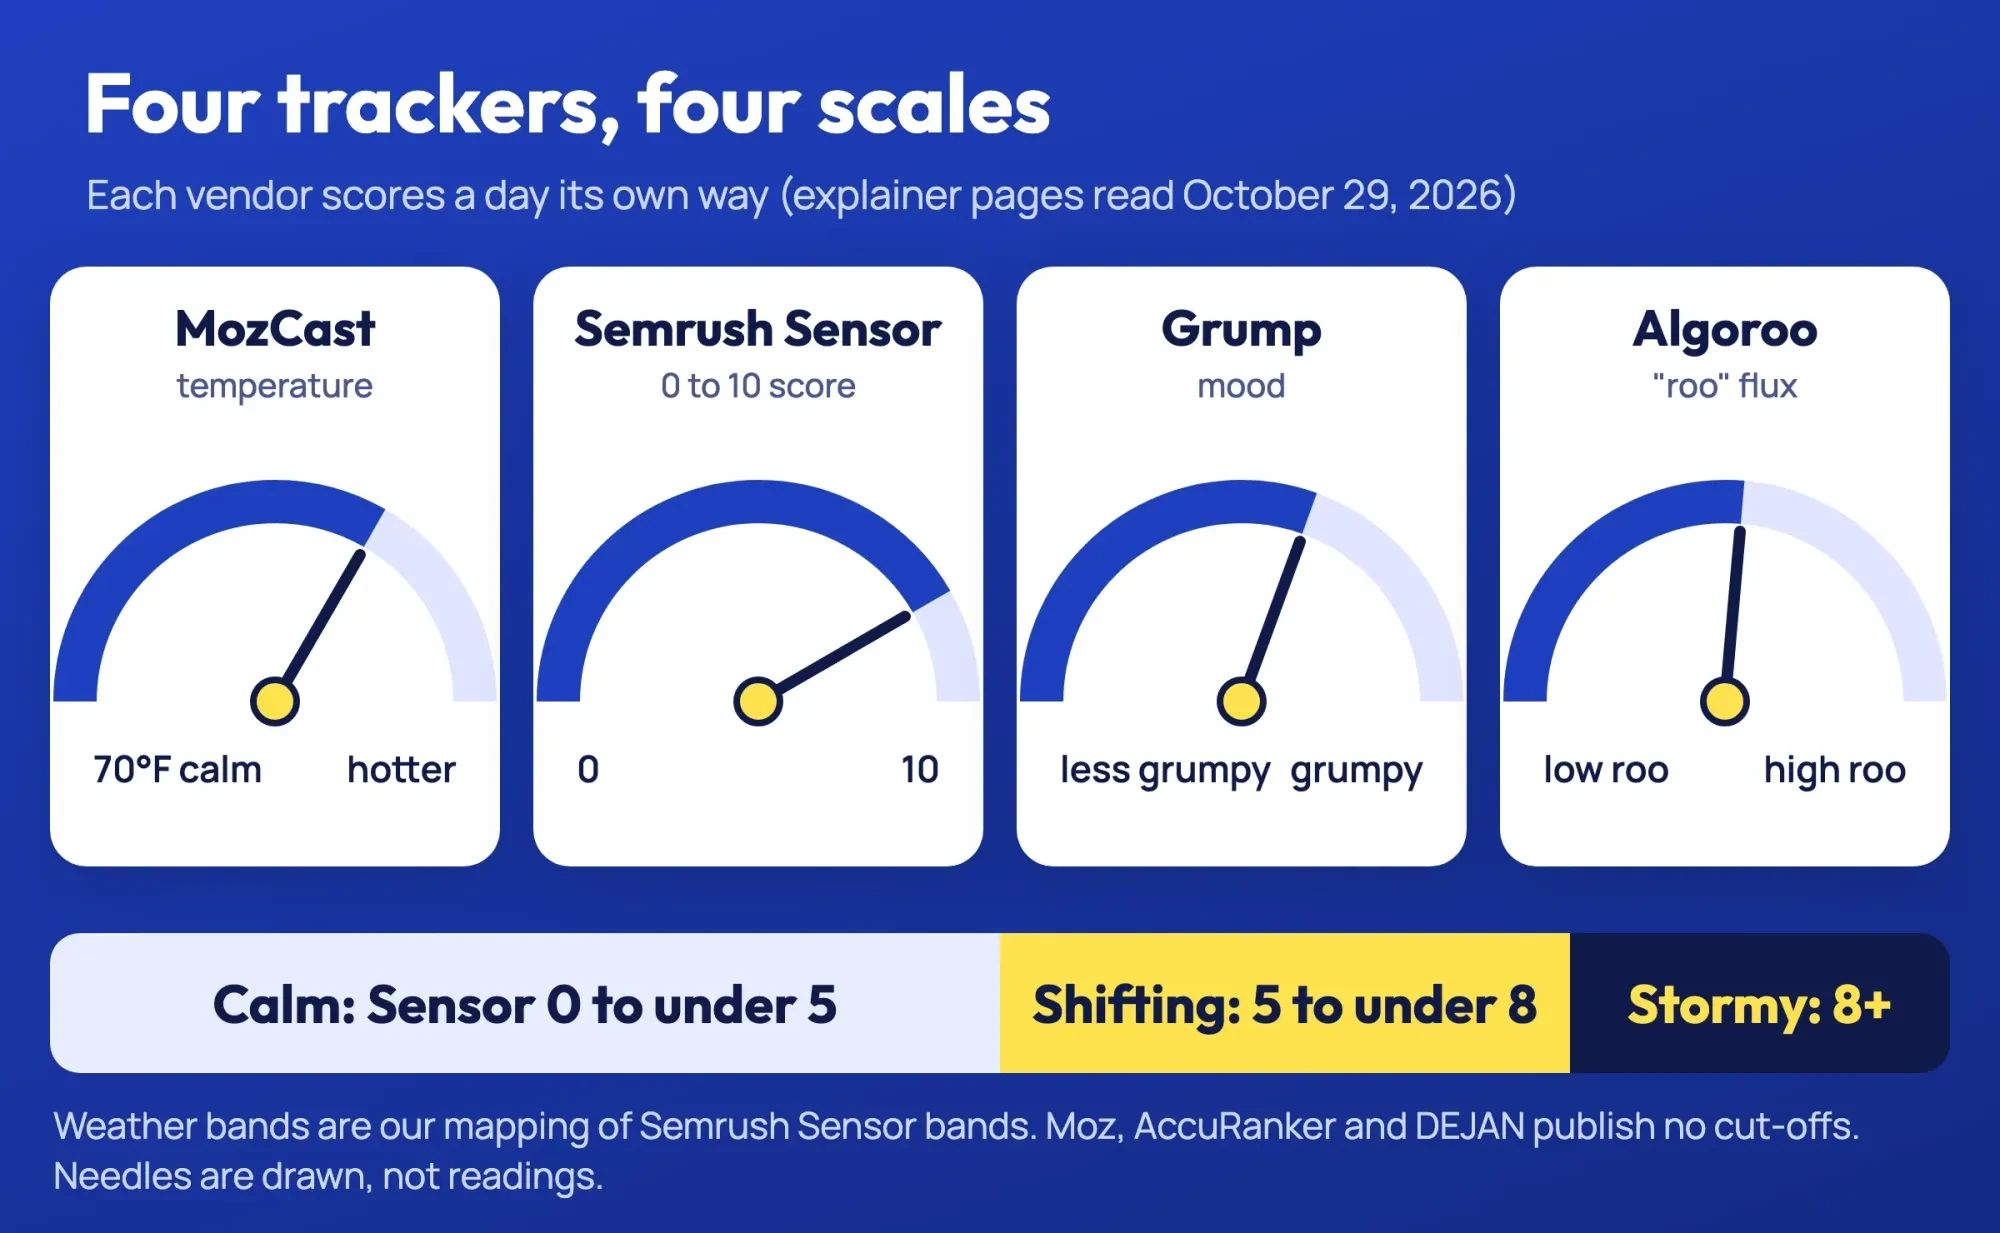 Drawn by us: scales as each vendor describes them on its own page, read October 29, 2026; the Calm, Shifting and Stormy bands are our mapping
How weather words map onto each tracker's scale
That mix of scales is why weather words help. Only one vendor publishes bands to pin them to, though. Our drawings use Calm, Shifting and Stormy, so here's how those words line up with what each vendor actually says.
Semrush's Sensor help page gives the clearest bands: 0-2 is low, 2-5 normal, 5-8 high and 8-10 very high. The published bands share their end points, so exactly 5 goes in high and exactly 8 goes in very high. Our test script sorts those two values the same way.
MozCast gives an anchor, not bands. About 70°F is an uneventful day and hotter means more change, so a reading well above 70 is Shifting or worse in our words. Grump talks about mood, where grumpier means bigger swings, and Algoroo says a high roo value means high volatility. Neither publishes a cut-off, and we don't invent one. On Semrush's 0-10 scale, then, Calm covers 0 to just under 5, Shifting 5 to just under 8 and Stormy 8 to 10; the featured gauge uses the same words.
Why trackers flag updates Google never confirms
A tracker line can jump on a day Google posts nothing at all. Google's own answer is volume. Its post on how it updates Search says Search is updated thousands of times a year. In any given week, the same post says, Google might implement dozens of updates that people using Search generally don't notice.
Most of those changes don't get a name. Google says it's not useful to share details about all of them, and its core updates documentation adds that smaller core updates go unannounced because they aren't widely noticeable. A tracker that samples thousands of keywords can still catch one of those moves. If a quiet change reshuffles results for enough tracked keywords, the chart jumps even though nothing ever appears on Google's dashboard or blog. That gap between what a tracker sees and what Google announces is where the label unconfirmed update comes from.
Moz says MozCast was built to help spot those unconfirmed changes. It frames the job as one question: "Did Google change, or was it just me?" A tracker answers the first half; your own Search Console data answers the second. Semrush's help page also says Sensor monitors the volatility of over 30 SERP features, such as Local Packs, next to the main score. When the main line jumps, open those feature trends before you blame a ranking change, and see our Google ranking systems explainer for what runs underneath.
Is it a one-day spike or several high days?
Even during a confirmed update, a tracker's tallest bar is the least useful thing on the chart. Duration matters more. So does agreement between views.
Semrush's help page describes a Deviations tab that compares each day with the monthly average. It also calls its Winners and Losers list a sample rather than "an absolute across the entire web."
So we wrote our rules down before looking at any series. They're ours, built on Semrush's published bands, and they work on any 0-10 line:
Band:      Calm under 5 | Shifting 5 to under 8 | Stormy 8 or more   (0-10 scale)
Run:       consecutive days at 5 or more
QUIET:     no day at 5 or more
SPIKE:     longest run is 1 or 2 days
SUSTAINED: a run of 3 or more days
Scope:     if the comparison line stays under 5 on every day of the run, the move is LOCAL to this view
The 3-day line is a judgment call, not a vendor rule, and we picked it because Google's core updates roll out over days, not hours, on its dashboard. One example is the May 2026 core update, which started May 21, 2026 and is listed at 11 days, 21 hours. A lone high day can't match a rollout of that length on the dashboard, while a run of 3 or more high days at least can.
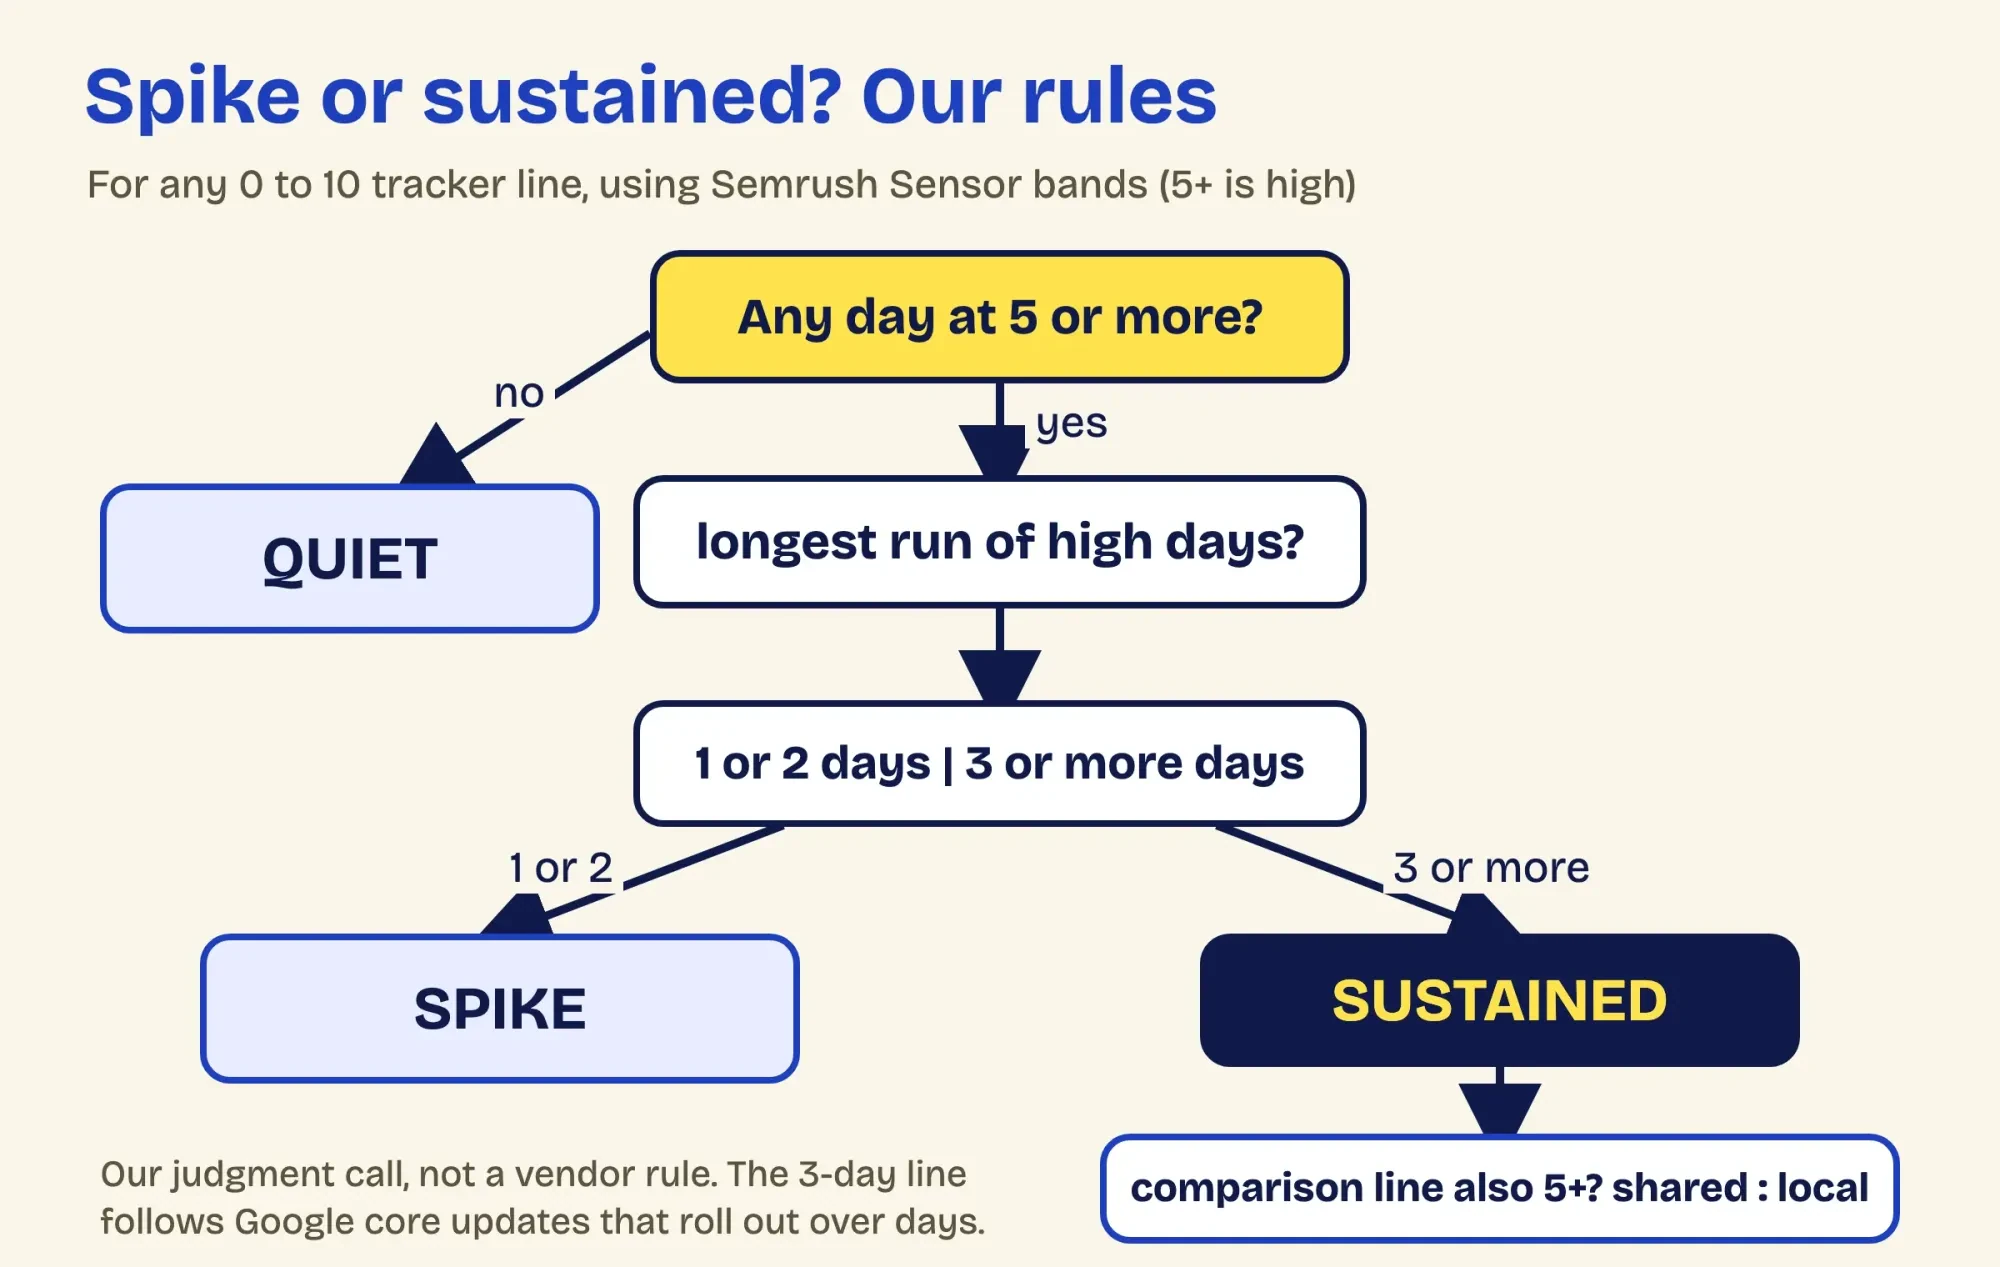 Diagram by DigitalTreed: our spike vs sustained rules, using Semrush Sensor bands read October 29, 2026
Niche and device lines can disagree with the headline
Beyond how long a high reading lasts, ask where it is. The headline number is an average across every category a tracker follows. Semrush's help page explains how to compare categories and set desktop against mobile, and notes that the Sensor Score tracks desktop results and all mobile except China. The Sensor page is summed up by Semrush as tracking 20+ categories, a count its help page doesn't repeat.
Grump filters by country and device. Algoroo switches between US and Australian Google, and between desktop and mobile.
A high run limited to google.com.au results tells a contractor in Dallas nothing about next week's calls, however alarming the headline chart looks. Neither does a high run in a category you never touch.
Your own data has the same splits. Google's Performance report help explains why two people can see different results for the same query. Its Devices and Countries tabs let you split your own clicks the same way. Semrush's Personal Score measures volatility for your own keyword set, but it sits inside the paid SEO Toolkit subscription. Search Console costs nothing, so filter its Performance report by Devices, then by Countries, and see whether either split moved on the days the tracker did.
Six made-up months through our volatility rules
Before trusting those rules, we ran them on example data. Every number in this test is made up to look like tracker lines, and none of it comes from MozCast, Semrush Sensor, Grump, Algoroo or any other tracker.
What we tested, and how
We typed six made-up example series into one file, 30 days each on a 0-10 scale, and ran a local Python script over them on October 29, 2026. It applied the rules above and printed every result to a text file.
Two series carried a comparison line to try the scope check. The script used no network and no tracker account.
What the six example series showed
That run produced six verdicts. The table lists each made-up example series exactly as the script printed it, with nothing left out:
| Example series | Peak (day) | Days at 5+ | Longest run | Verdict | Scope |
|---|---|---|---|---|---|
| A: a quiet month | 4.6 (day 14) | 0 | 0 | Quiet | Not checked |
| B: one stormy day | 9.4 (day 14) | 1 | 1 day | Spike | Not checked |
| C: a two-day blip | 6.1 (day 9) | 2 | 2 days | Spike | Not checked |
| D: twelve high days in a row | 8.7 (day 16) | 12 | 12 days | Sustained | Not checked |
| E: one niche high, all categories calm | 7.2 (day 17) | 5 | 5 days | Sustained | Local (all categories max 4.7) |
| F: mobile high, desktop touches 5 once | 6.4 (day 21) | 3 | 3 days | Sustained | Shared (desktop max 5.2) |
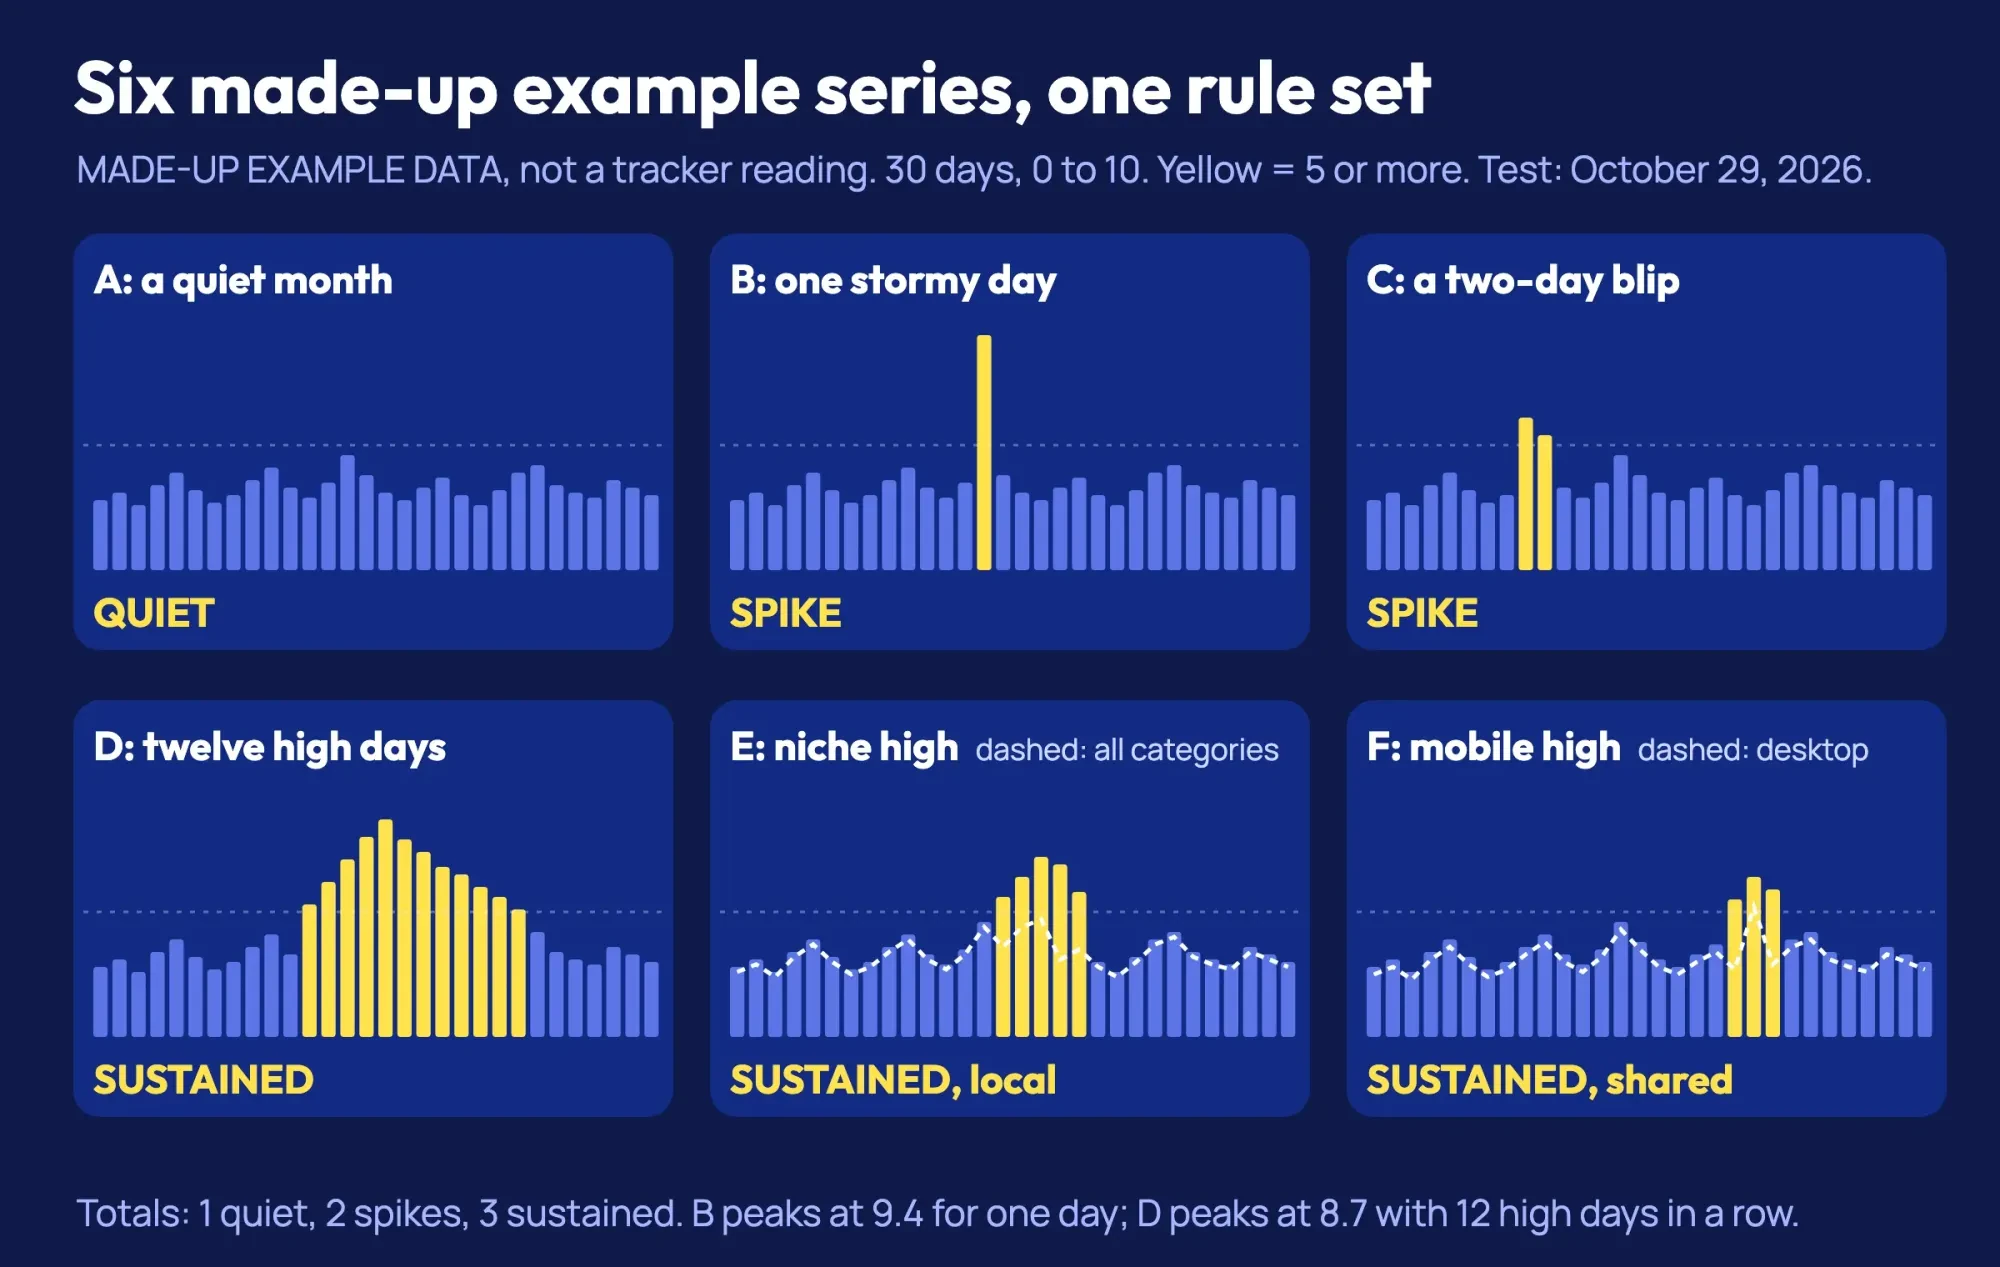 Source: DigitalTreed volatility script run on made-up example data, October 29, 2026 (test/output.txt)
The totals were 1 quiet, 2 spikes and 3 sustained. Example B peaked at 9.4, higher than any day in example D at 8.7, yet only D met the sustained rule. D's own peak of 8.7 came on day 16, the fifth day of its 12-day run. Read by its peak alone, B looks like the bigger event, since its single bar towers over everything else on a 30-day chart. Under our rule it's a spike, because its other 29 days stay under 5. Example C, the two-day blip at 6.1 and then 5.4, also stayed a spike, and that's the borderline case the 3-day line exists for.
Example E shows why the niche view matters. Its category line stayed high for 5 days while the all-categories line peaked at 4.7, so the move stayed local to that niche. Its peak, 7.2, came on day 17. Example F exposed a weak spot in our own rule. Desktop reached 5.2 on just one day, and that single touch was enough for the script to call the move shared. A stricter version would ask the comparison line for its own run of 3 days. We'd use that version for a real decision, since one borderline day on a second line is thin evidence of a shared change.
Cross-check a high reading before you touch your site
Once a reading is both sustained and shared, leave the tracker and check Google's own sources. Google's Search Status Dashboard FAQ says the dashboard lists ranking updates relevant to website owners, and it offers an RSS feed so new entries reach you without checking by hand. But what if that run of high days isn't on the ranking history? Google's FAQ says an issue that isn't listed may be isolated to your pages, or may affect a limited number of searchers or sites. Then your Search Console data decides what happens next. The Performance report's Daily view is meant for spotting spikes, while Weekly smooths out weekend and holiday swings.
Mark the tracker's high days on your own chart. Google's post on custom annotations says you right-click the Performance chart, choose Add annotation and write a note of up to 120 characters. Everyone with access to the property sees these notes, so keep anything sensitive out of them. Put the tracker's name and the run of days in that note, so anyone reading the chart months later knows where the date came from. If your clicks held steady through those days, you're done. If they dropped, the full check lives in our Google algorithm updates guide, and the Search Console walkthrough shows where each filter sits.
A drop on days when the trackers stayed calm points back at your own site, not at Google. Start with the DigitalTreed website audit tool, which runs SEO and speed checks on a page. The algorithm updates guide linked above lists the faults to rule out before you blame an update.
A weekly tracker routine you can keep up
Those checks fit in five steps and a short weekly slot. This is the order we'd run them for a US business site with one person minding SEO:
- Open two trackers and note any run of 3 or more high days, not the single tallest bar.
- Switch to the category closest to your business, then flip between desktop and mobile.
- Check Google's Search Status Dashboard for a ranking update that overlaps those days.
- Annotate the dates in Search Console and compare your daily clicks on desktop and mobile.
- Change nothing on your site if your own clicks held, even when the trackers stayed high.
Step 5 asks you to do nothing, which is harder than it sounds. A red week on a tracker with flat clicks on your site is a week to leave alone. Google's traffic drop guide recommends avoiding radical changes to a page that's already performing well. Rankings for a handful of pages can drift a few places and drift back, and the guide says those small moves can reverse without you doing anything.
If your clicks did fall and you'd rather hand off the digging, a site-wide review is part of our SEO services. Full disclosure: we charge for that review, and we have no tie to Moz, Semrush, AccuRanker or DEJAN.
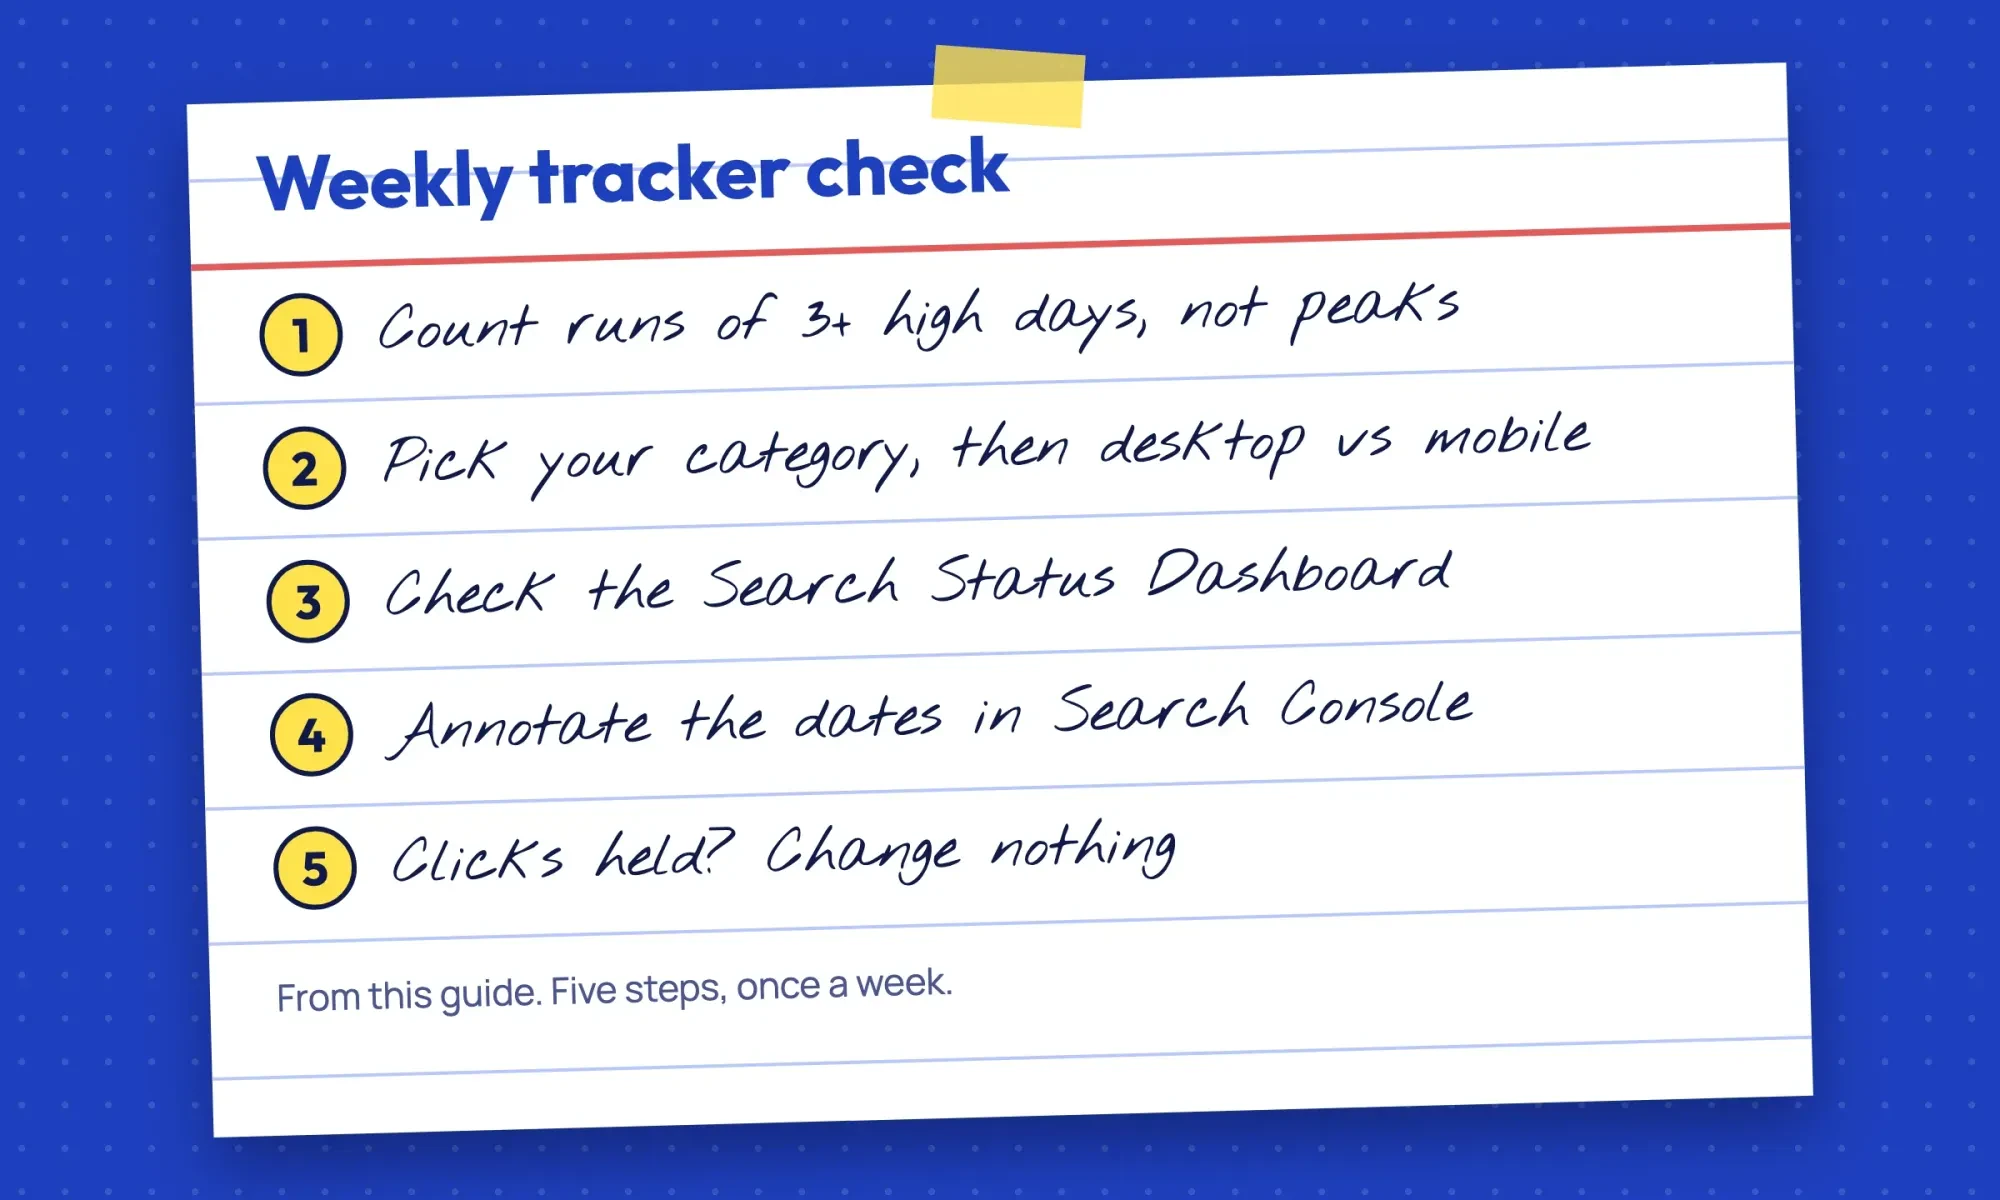 Drawn by us: the five-step weekly check, taken from the list above
Google algorithm tracker questions
Frequently asked
Is MozCast free to view?
Yes. The MozCast page opened without an account on October 29, 2026, and Moz says it has run since 2012 over a controlled data set.
Can I get an alert when a tracker spikes?
For Sensor, yes: Semrush's Sensor documentation offers email or browser push notifications when it notices significant fluctuations.
How far back does Google's update history go?
Five years. Google's dashboard FAQ says issues and updates stay on the Summary and History page that long.
Why does Grump read 30 results when MozCast reads page one?
AccuRanker's Grump page says it compares all 30 rankings with the day before, then divides the summed differences by the number of results.
How we made this guide: We drew on what Moz, Semrush, AccuRanker, DEJAN and Google publish about their own charts, linked at each fact and read on October 29, 2026. The volatility test used made-up example data on one Mac, with no tracker login and no live reading recorded. Facts checked by the DigitalTreed team on October 29, 2026.
First published July 2020 as a news note on a June 2020 unconfirmed update. Rewritten October 29, 2026 as an evergreen guide to reading SERP volatility trackers; the update history now lives in our Google algorithm updates history.
Sources
- Moz: MozCast, the Google algorithm weather report
- Semrush Knowledge Base: Sensor
- Semrush: Semrush Sensor
- AccuRanker: Google Grump Rating
- DEJAN: Algoroo
- Google blog: How we update Search to improve your results, June 2, 2021
- Google Search Central: Google Search's core updates and your website
- Google Search Central: Using the Google Search Status Dashboard
- Google Search Status Dashboard: History for Ranking
- Google Search Central: Debugging drops in Google Search traffic
- Search Console Help: Performance report (Search results)
- Search Central blog: Adding context to your Search Console data with custom annotations, November 17, 2025


Comments
No comments yet. Start the conversation below.