
Quick answer
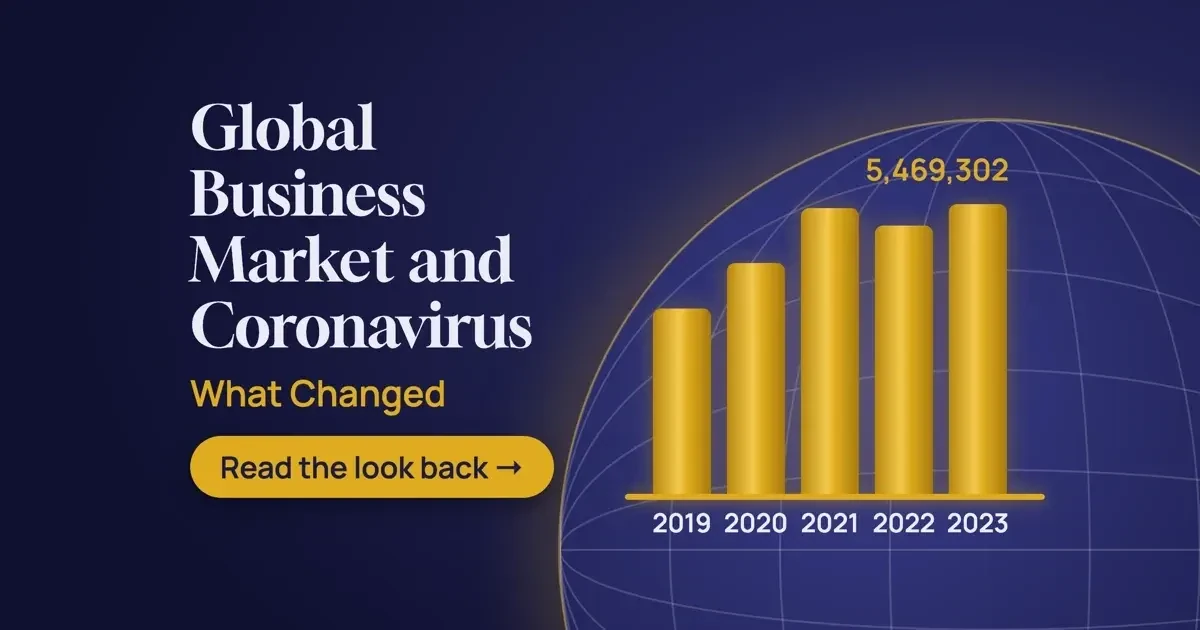
The global business market and coronavirus shock hit small US businesses hardest in spring 2020: the Census Bureau's first Pulse survey found 51.4% reporting a large negative effect. New business applications still reached 5,390,816 in 2021, up from 3,498,990 in 2019. This is a dated look back at 2020-2023. If you still hold a PPP or EIDL loan, start with the SBA table.
If you run or advise a small US business, this look back is for you. The global business market and coronavirus effect is a chain of changes. It began with closures and job losses in 2020, then moved to supply delays, price rises and a surge of new business filings. We've used only Census, BLS, SBA, GAO and IMF pages, read on November 9, 2026, and we're treating March 2020 forecasts as dated history only.
We start with how hard the first months hit small business, then compare global forecasts with results. Next come what PPP and EIDL put in place, whether new businesses really surged, and the supply delays and price increases of 2021. The last two sections cover what the data can't tell you and which current numbers to watch instead.
Key takeaways
- Census found 51.4% of small businesses reported a large negative effect in spring 2020.
- BLS counted 20.5 million fewer payroll jobs in April 2020 alone.
- US business applications grew from 3,498,990 in 2019 to 5,390,816 in 2021.
- PPP got about $814 billion in commitment authority and ended May 31, 2021.
- Census Pulse data stops after April 2022, so later comparisons need other series.
How hard did the first months hit small business?
The first hard numbers came from the Census Bureau's own survey. It launched the Small Business Pulse Survey in April 2020 and emailed small businesses every week. The first results, released May 14, 2020, covered 22,449 responses from April 26-May 2, out of 100,915 businesses invited. They "show a large negative effect from COVID-19 for the majority (51.4%) of respondents".
Food and lodging took the worst of it. In accommodation and food services, 83.5% of surveyed businesses reported a negative effect. Across all sectors, an average 41.4% had temporarily closed a location for at least one day that week. An average 31.4% expected more than six months to pass before they returned to usual operations. Supply chains were already strained: an average 44.9% reported disruptions, and 65.8% in retail trade.
Jobs fell the same way. The BLS Employment Situation report for April 2020 says "Total nonfarm payroll employment fell by 20.5 million in April", and the unemployment rate rose to 14.7%. It names "particularly heavy job losses in leisure and hospitality". By winter the picture had split. A Census story from January 25, 2021, written as Phase 3 ended, carries the headline "16.5% of Businesses Experienced Little or No Effect from Pandemic, 55.3% Expect Long-Term Challenges". In educational services 72.1% of businesses reported a decline in capacity, against 44.5% in construction. We'd read that as a warning against planning on one national average, because a construction owner and an educational services owner weren't living through the same year.
The reasons differed too. In educational services, "physical distancing of customers or clients" was the most cited reason for lost capacity, at 36.1%, while only 11.0% of construction businesses named it.
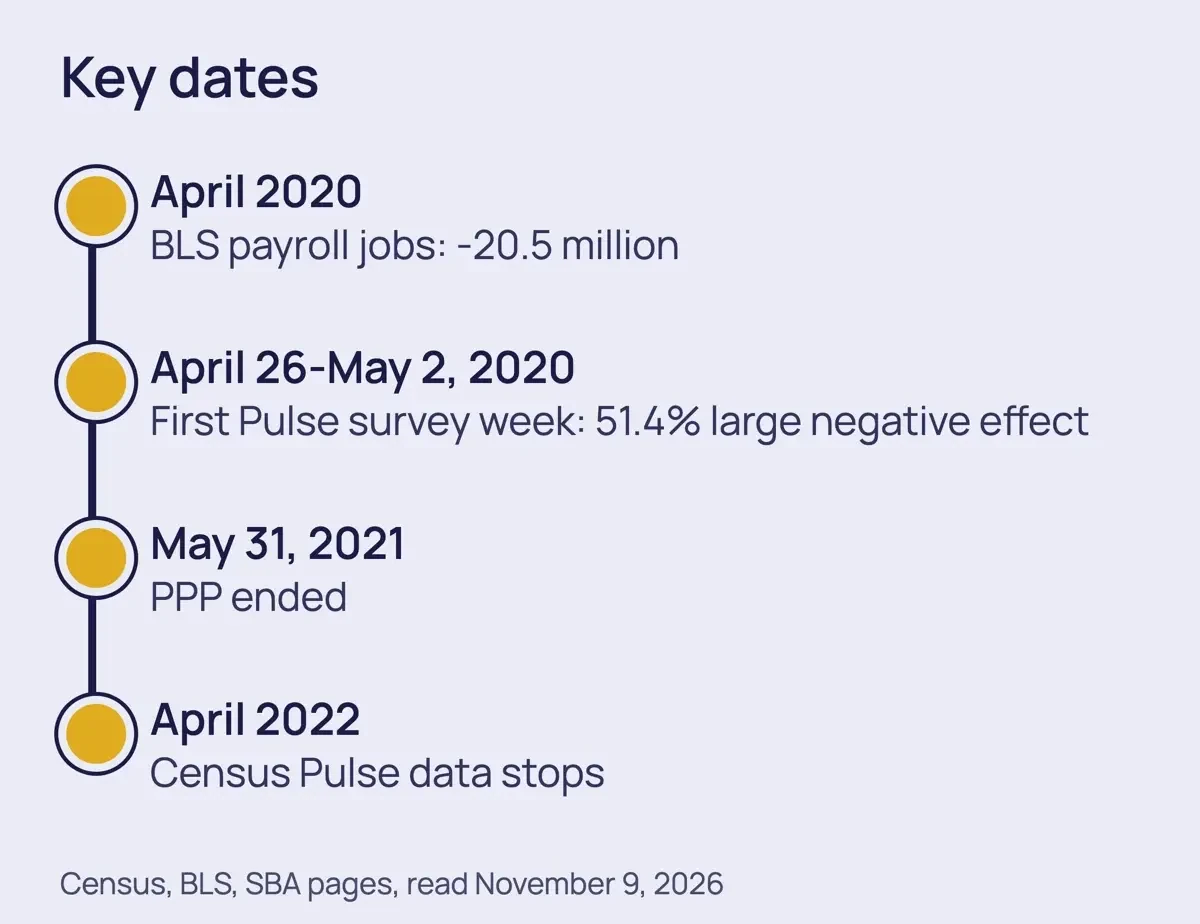 Diagram by DigitalTreed, from the Census, BLS and SBA pages in Sources, read November 9, 2026.
The global business market and coronavirus: forecasts versus results
After the first months, global forecasts moved as fast as the facts. The IMF's April 2020 outlook said the world economy was "projected to contract sharply" by 3% in 2020, and called that "much worse than during the 2008-09 financial crisis". It's a projection made while lockdowns spread, so we're showing it as history. Nine months later the IMF's January 2021 update estimated the 2020 contraction at 3.5%, which it called "0.9 percentage point higher than projected in the previous forecast". That puts the April 2020 projection half a point too mild. It also implies the previous forecast was a 4.4% contraction (formula: 3.5 + 0.9), so a single quarter's projection wasn't the final word.
By April 2023 the IMF's baseline had turned to slower growth. Its baseline forecast had global growth falling from 3.4% in 2022 to 2.8% in 2023. The OECD published pandemic forecasts too, but its pages returned a 403 bot-block to our checker, so none of its numbers appear here, and we won't guess them. If you need them, open the OECD Economic Outlook archive in a browser.
Owners of shops and agencies can take one lesson from this: timing matters.
Global figures arrive late and get revised. Your own sales and supplier delays show first, so we'd track those monthly.
What PPP and EIDL put in place
Once the shock was clear, most US relief for small business ran through two SBA programs. SBA's COVID-era programs page says "The COVID-19 EIDL program provided loans and advances to help businesses recover from the economic impacts of the pandemic". PPP, it adds, "helped businesses keep their workforce employed". As of November 2026 the page describes both in the past tense. PPP wasn't small. GAO's report GAO-21-601 says Congress "ultimately provided commitment authority of approximately $814 billion for the program over three phases", and GAO-21-577 gives about $814 billion as well. We couldn't fetch a final loan count from an official page, so we don't give a total of loans approved.
SBA's page is blunt: "The PPP ended on May 31, 2021."
Early lending wasn't even. GAO found that 42% of Phase 1 loans, approved April 3-16, 2020, went to businesses with 10 to 499 employees. Those businesses were only 4% of all US small businesses, in GAO's count.
SBA then admitted about 600 new lenders for Phase 2. By the time PPP closed, GAO says, "lending in traditionally underserved counties was proportional to their representation in the overall small business community". Lending to businesses with fewer than 10 employees stayed disproportionately low.
| Program | SBA's wording | Where |
|---|---|---|
| PPP | Interest rate of 1%. Maturity of two years for loans before June 5, 2020, five years after. No collateral or personal guarantees. Ended May 31, 2021. | SBA COVID-era programs page |
| PPP forgiveness | Effective March 13, 2024, all borrowers, regardless of loan size, can use SBA's direct forgiveness portal. | SBA COVID-era programs page |
| COVID-19 EIDL | Provided loans and advances. Eligible borrowers can cut payments by 50% for six months, once every five years. | SBA COVID-era programs page |
If you took either loan, read your own terms or ask your lender. SBA says borrowers can apply for PPP forgiveness "any time up to five years from the date that SBA issued the SBA loan number". EIDL payment assistance is meant for temporary cash-flow trouble, and the forgiveness portal date matters if you haven't asked yet. For newer funding, see our guides to business loans and early-stage startup funding.
If you still owe a COVID EIDL, SBA's conditions for payment assistance are worth reading line by line. The loan must be "less than 90 days past due at the time of the request" and in current status. The business must be "actively open and operating". The request must be for a temporary difficulty, not a long-term challenge. SBA also warns that missed payments can lead to referral to the Treasury Offset Program "after reaching 120 days of delinquency". We aren't lenders, so ask SBA or your lender what applies to your loan.
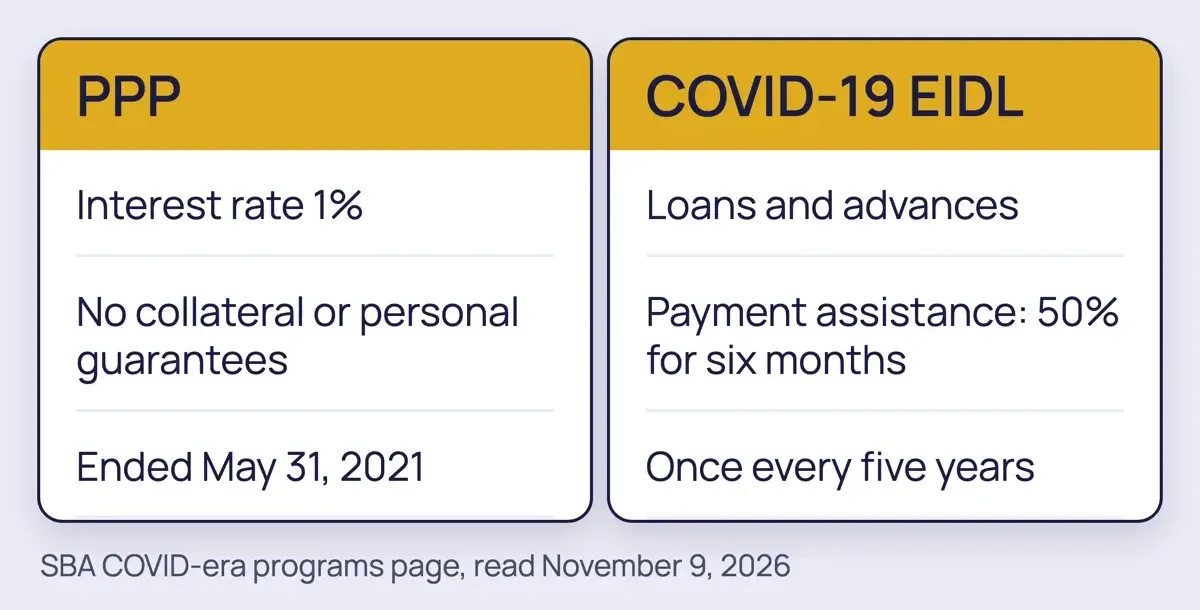 Diagram by DigitalTreed, from SBA's COVID-era programs page, read November 9, 2026.
Did new businesses really surge?
Now that relief is covered, the Census Bureau's Business Formation Statistics answer the formation question from tax-ID filings. Its definitions page describes the core series as "Business Applications - The core business applications series that corresponds to a basic filtering of EIN applications".
An application is a filing, not an open shop. Census counts the ones that become employer businesses in a separate series, "Business Formations within 8 Quarters".
We added the 12 monthly values of each year from Census's monthly BFS file (unadjusted, US total). Applications rose 24.5% in 2020 and another 23.7% in 2021. They slipped 6.1% in 2022 and grew 8.0% in 2023, and the 2023 total stayed 56.3% above 2019. Even the 2022 dip left applications 44.7% above 2019 (formula: 5,062,563 / 3,498,990 - 1).
| Year | Business applications | Change vs 2019 | With planned wages | Change vs 2019 |
|---|---|---|---|---|
| 2019 | 3,498,990 | +0.0% | 478,640 | +0.0% |
| 2020 | 4,356,498 | +24.5% | 524,651 | +9.6% |
| 2021 | 5,390,816 | +54.1% | 638,140 | +33.3% |
| 2022 | 5,062,563 | +44.7% | 578,669 | +20.9% |
| 2023 | 5,469,302 | +56.3% | 613,708 | +28.2% |
The planned-wages column counts applications that give a first wages-paid date, which Census links to a "high likelihood of transitioning into a business with payroll". It rose 33.3% from 2019 to 2021, less than all applications. So many new filings may never have become employers, and we wouldn't read the surge as 1,891,826 new employers (formula: 5,390,816 - 3,498,990). That doesn't mean each filing became a firm, and it isn't a count of open shops.
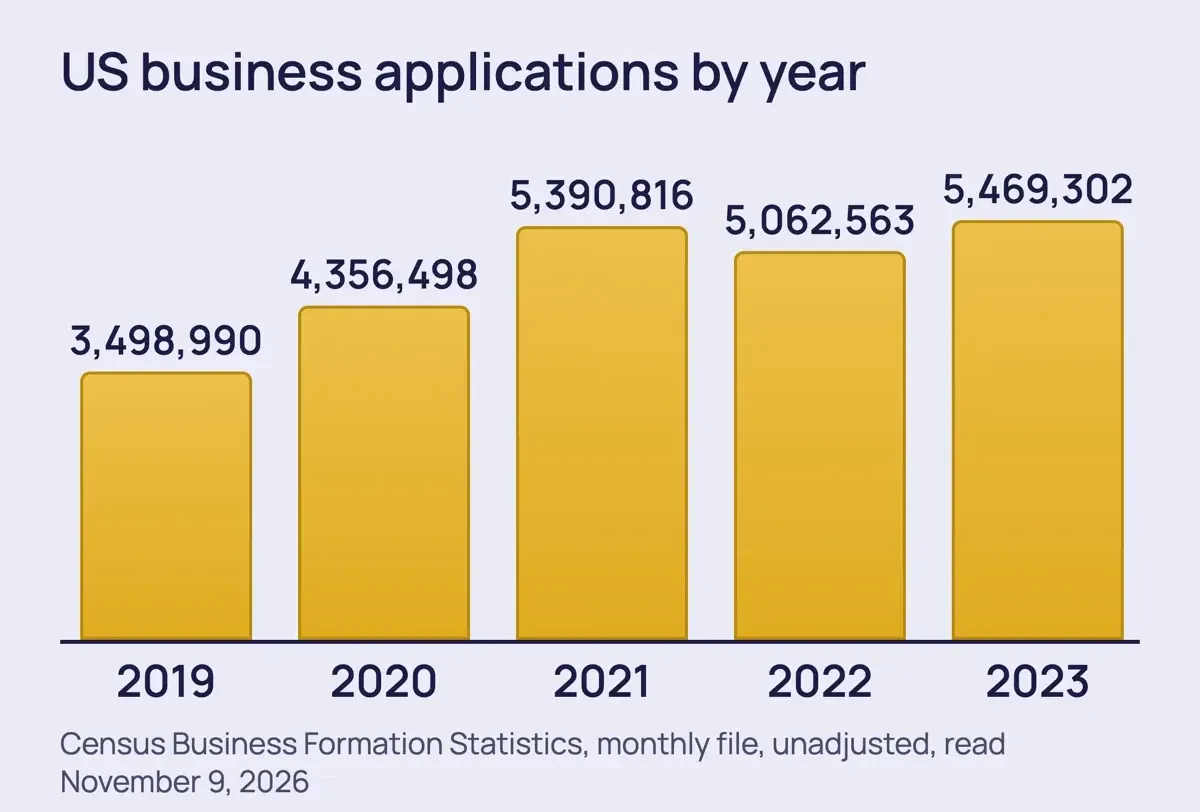 Diagram by DigitalTreed, drawn from the Census Business Formation Statistics monthly file, read November 9, 2026.
What we tested
On November 9, 2026 we saved the pages named in Sources and wrote a short script to run on the copies. It searched 63 figures and quotes word for word, and 63 were found. It then summed the monthly Census file and built the page we served on 127.0.0.1. We didn't log in anywhere.
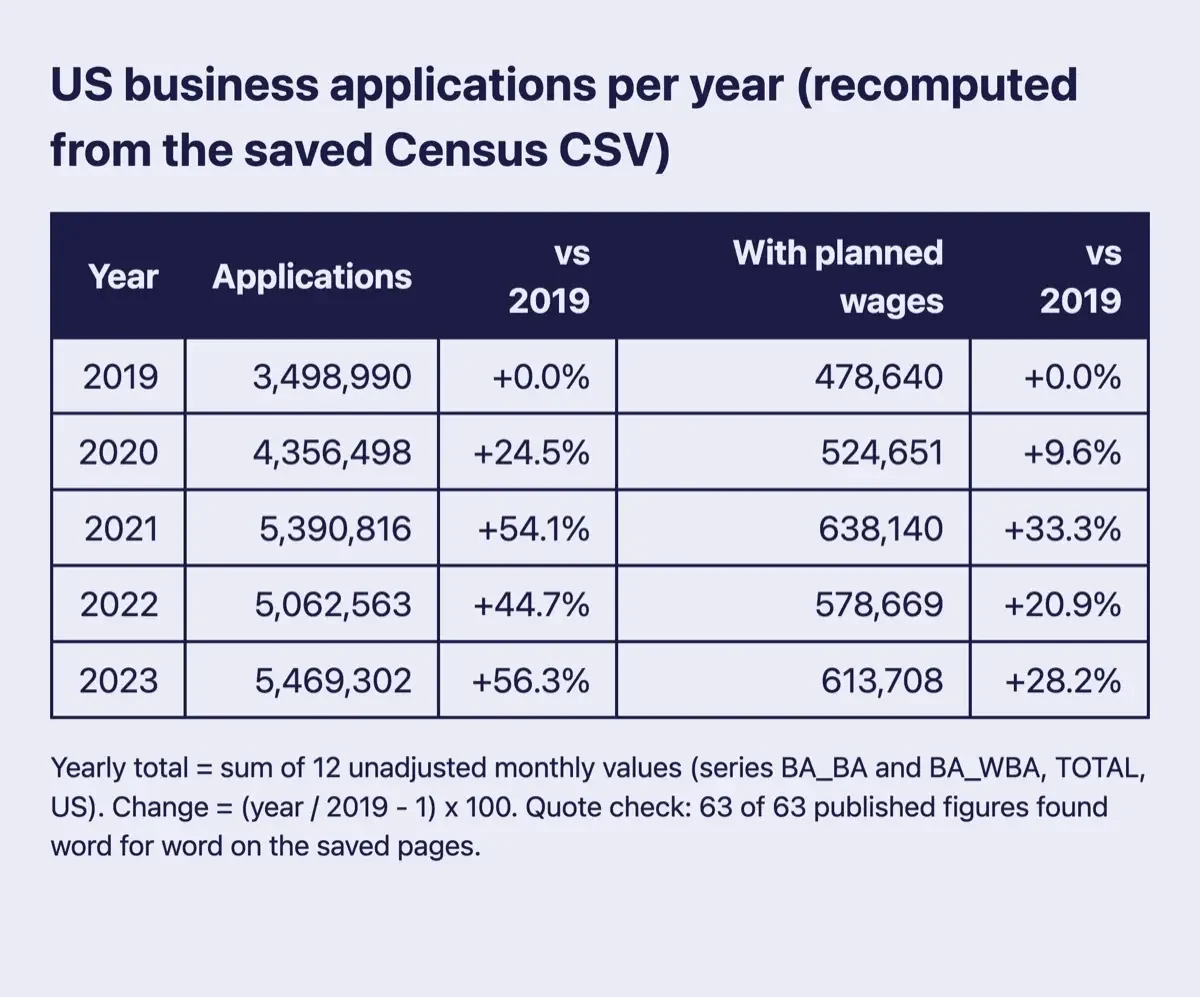 Screenshot: our check page served on 127.0.0.1, November 9, 2026. The numbers are Census figures we recomputed.
Supply delays and price increases in 2021
Once demand returned, the strain moved to supply. The Census story of August 9, 2021 reports that 38.8% of small business respondents had domestic supplier delays in the last week of Phase 5 (July 12-18). That's up from 30.9% at the close of Phase 4. In manufacturing the share was 64.6%, and Census doesn't say why.
Prices followed. In week five of Phase 6 (September 13-19, 2021), the November 30, 2021 Census story says the national average reporting large price increases was 28.8%, and moderate increases 40.3%. In that week 54.4% of construction businesses reported large increases, against 18.5% of utilities. Those shares compare prices with what was normal before March 13, 2020, so read them as a gap from the pre-pandemic baseline rather than a one-year change.
That's why we read 2021 as a cost problem more than a demand problem. An owner who raised prices in step with supplier costs, and tracked each supplier's delivery dates, didn't need a headline to read the same signals Census reported. If your sales had moved online by then, our ecommerce website guide and ecommerce trends for a small store cover the store side. Both patterns hit sectors unevenly, so we'd compare your supplier costs with your own sector's numbers, not the national average.
Other delays followed. At the close of Phase 5, 22.7% of respondents reported delivery and shipping delays, against 18.5% at the close of Phase 4. Finding alternative domestic suppliers was hard for 18.9%, up from 13.0%.
What the data can't tell you
But every figure above has a limit, and we'd rather say so than hide it. The Pulse survey went out by email, and Census said in January 2021 that business survival and email-only sampling "can bias the responses". Its results are labeled experimental on the survey page, which lists Phase 1 as April 2020 - June 2020 and Phase 8 as February 2022 - April 2022. Phase 8 was the last one, and it didn't run past April 2022. After that the series changed. Census says the Business Trends and Outlook Survey "is the successor to and builds upon the Census Bureau's Small Business Pulse Survey".
A Census story of August 2023 adds that its COVID Hub "stopped updating data on the site in February 2023". So a long Pulse-based chart through 2023 doesn't exist, and anyone comparing 2020 with 2023 needs other series, such as the business applications and jobs data above.
Employment is the one story with a clean ending.
The BLS report for July 2022 says "Both total nonfarm employment and the unemployment rate have returned to their February 2020 pre-pandemic levels." By our count that's 29 months, counting March 2020 through July 2022. If you kept a remote team, our remote work security tips still apply.
Where to watch the numbers now
So which numbers replace the Pulse survey? Three official series carry the work forward, and none is a COVID survey.
- Census Business Formation Statistics: monthly new business applications, the series behind our table.
- BLS Employment Situation: a monthly jobs report, with the unemployment rate.
- Census Business Trends and Outlook Survey: a survey of business conditions, published every two weeks.
The Business Formation Statistics page says the series "provide timely and high frequency information on new business applications and formations in the United States". The latest BLS Employment Situation is the October 2026 release, which reports payroll employment up by 165,000 and an unemployment rate of 4.1%. And the Census BTOS story says the survey "will collect and publish data products every two weeks". We'd bookmark all three and skim them monthly instead of waiting for a headline.
We'd keep the routine simple. Once a month, note the BLS payroll change, the Census applications total and your own supplier delays in one spreadsheet row. It isn't a forecast, but a turn in your own numbers will show up there well before any official outlook gets revised to match it. Marketing shifted too, though none of these pages measure it. We can't give you a number for that. If you rebuilt your customer list or social plan after 2020, we'd start with email marketing for small businesses, a social media plan and B2B versus B2C marketing.
Questions about the pandemic and small business
Frequently asked
Can I still apply for PPP?
No. SBA says "The PPP ended on May 31, 2021." Existing borrowers may still be eligible for forgiveness.
Is the Small Business Pulse Survey still running?
Its last phase covered February 2022 - April 2022 on the Census survey page, and the Business Trends and Outlook Survey is its successor.
When did US jobs return to their pre-pandemic level?
In July 2022, according to BLS, when employment and the unemployment rate matched February 2020.
Can COVID EIDL borrowers get lower payments?
Sometimes. SBA says eligible borrowers can cut payments by 50% for six months, once every five years, if the loan is current.
How we made this guide: We saved the 19 official pages in Sources on November 9, 2026, and a script matched every quote and figure to them. The 2020 post this replaces carried OECD forecast numbers we couldn't source, so none remain. Facts checked by the DigitalTreed team on November 9, 2026.
First published April 2020 as a live look at forecasts. Rewritten November 9, 2026 as a dated look back at 2020-2023.
Sources
- U.S. Census Bureau: Small Business Pulse Survey
- Census: New Small Business Pulse Survey Shows Breadth of COVID-19 Impact on Businesses (May 14, 2020)
- Census: Small Business Pulse Survey Shows Shift in Expectations from Spring to Winter (January 25, 2021)
- Census: U.S. Small Businesses Suffer Supply Chain Disruptions (August 9, 2021)
- Census: Small Business Pulse Survey Reveals Price Increases by Sector (November 30, 2021)
- Census: Business Trends and Outlook Survey, New Light on Business Health (June 23, 2022)
- Census: Now That the Pandemic Emergency Has Ended, What's Next? (August 8, 2023)
- Census: Business Formation Statistics
- Census: Business Formation Statistics, Definitions
- Census: Business Formation Statistics, monthly data file
- BLS: The Employment Situation, April 2020
- BLS: The Employment Situation, July 2022
- BLS: The Employment Situation, latest release (October 2026)
- SBA: COVID-era programs
- GAO-21-601: Paycheck Protection Program, Program Changes Increased Lending to the Smallest Businesses
- GAO-21-577: Paycheck Protection Program, SBA Added Program Safeguards, but Additional Actions Are Needed
- IMF: World Economic Outlook, April 2020, The Great Lockdown
- IMF: World Economic Outlook Update, January 2021
- IMF: World Economic Outlook, April 2023, A Rocky Recovery
1 comment
jigyasa sewkani
The economy of the world is dying because of the virus.
Reply