

Quick answer
Account management raises sales efficiency by steering account hours to the customers who return the most profit after cost to serve. In our made-up 12-account book, the three accounts that cost most to serve took 53.5% of hours but gave 28.4% of profit (example figures). Rank accounts by profit after cost to serve, then write a key account plan for the top few.
Account management is a sales job that keeps, grows and serves existing business customers after the first deal closes. Whether it pays shows up in your own book, as profit per account hour. Federal job data files that work under sales codes, where sales managers earned a $148,270 median wage in May 2025.
In the example book below, two lost accounts cut net revenue retention to 92.2%, and the top revenue account wasn't the top profit account once cost to serve came out.
Key takeaways
- Rank key accounts by profit after cost to serve, not by revenue.
- Two lost accounts pulled our example net revenue retention down to 92.2%.
- Gupta, Lehmann and Stuart: a 1% retention gain improves firm value by 5%.
- Reinartz and Kumar: long-life catalog customers weren't necessarily profitable.
- Write key account plans around activities, actors, resources and formal rules.
Where does account management save selling time?
Here, sales efficiency means profit per hour of selling work, and it's the same measure whether that hour goes to a new logo or an old one. Gupta, Lehmann and Stuart (2004) valued five firms' customers from public data. Their abstract reports "a 1% improvement in retention, margin, or acquisition cost improves firm value by 5%, 1%, and .1%, respectively." That's a 50-to-1 gap. Hours are the other lever. A rep who gives 260 hours a year to one account, like our example account A, isn't prospecting during them. That's fine only if the account's margin pays for them. In the example book, that's what A did. It cost $21,757.60 to serve and still returned $77,682.40 in profit after serve.
Reinartz and Kumar tested whether "the costs of serving long-life customers are less" with three years of daily data from a large catalog retailer. The results, in their words, "challenge all the expectations derived from the literature." Read together, the two abstracts suggest a kept account's worth its hours when its margin covers them. That test decides whether spare hours go to cold outreach for new B2B logos or to accounts you've already won. Our post on customer acquisition and retention strategies covers both sides.
Who does account work, per BLS data
Those hours sit with people whose job titles vary. The federal pages we read don't give account managers their own code, but O*NET lists "Account Representative" among reported titles for wholesale and manufacturing sales representatives. For sales representatives of services, one listed task reads "Consult with clients after sales or contract signings to resolve problems and provide ongoing support." That's account management, filed under a rep's job code.
| Role (SOC code) | Median pay, May 2025 | Employment, 2025 | Source |
|---|---|---|---|
| Sales managers (11-2022) | $148,270 a year | 650,100 | BLS OOH |
| Wholesale and manufacturing sales reps, technical and scientific (41-4011) | $104,920 a year | 292,000 | O*NET |
| Wholesale and manufacturing sales reps, except technical (41-4012) | $72,080 a year | 1,279,400 | BLS OOH |
| Sales representatives of services (41-3091) | $69,990 a year | 1,272,700 | O*NET |
| Customer service representatives (43-4051) | $44,770 a year | 2,666,000 | BLS OOH |
BLS projects sales manager jobs to grow 4% from 2025 to 2035. Customer service rep jobs are projected to fall 5% over the same decade, per the BLS customer service page. Wholesale and manufacturing reps as a group show a $76,460 median wage and 0% projected change, so most openings there come from replacing workers who leave. Their duties include "Follow up with customers to make sure that they are satisfied with their purchases".
For the cost math below, we price one account hour at $36.76, the BLS median hourly wage for wholesale and manufacturing sales reps in May 2025. That's wage only. Your loaded cost with benefits runs higher. If you're also hiring for new business, see our business development director job description and span of control guide.
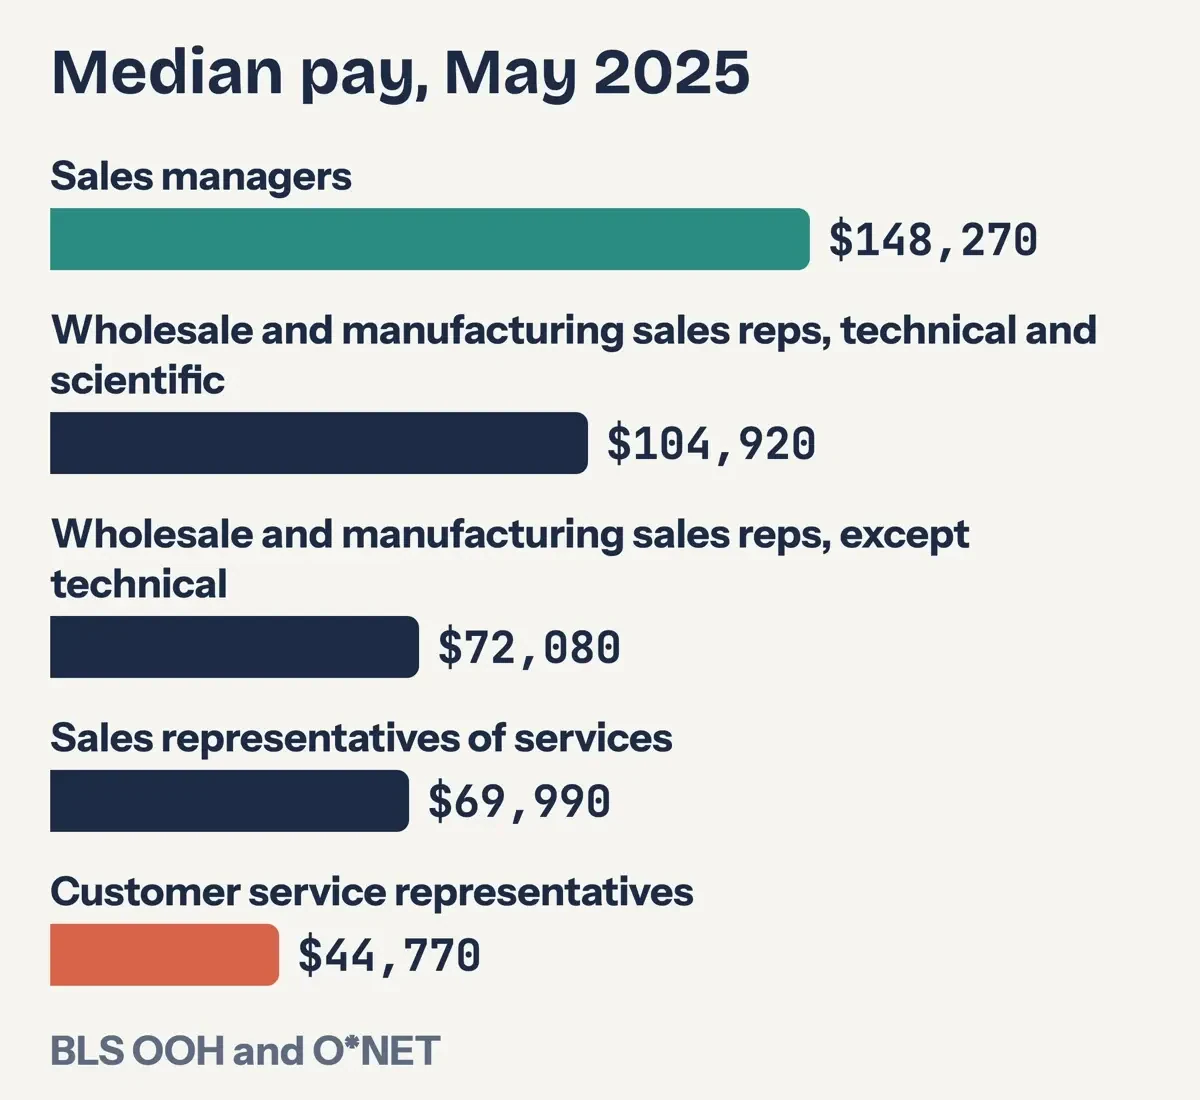 Source: BLS Occupational Outlook Handbook and O*NET, median pay for May 2025, drawn by DigitalTreed.
What does the research say about retention?
That leaves the question of whether retention work pays back. Venkatesan and Kumar's 2004 Journal of Marketing paper tested lifetime value as a way to select customers. Its abstract reports "Customers who are selected on the basis of their lifetime value provide higher profits in future periods" than customers picked by several other customer-based metrics. A 2006 review by Gupta and seven coauthors defines customer equity as "the sum of the lifetime values of the company's customers". Earlier, Gupta and Lehmann used public data and "a simple formula to estimate the lifetime value of a customer". It's built for publicly traded firms, per their abstract.
The Reinartz and Kumar abstract also says "Long-life customers are not necessarily profitable customers." Their data came from a catalog retailer that didn't use contracts. The same abstract notes longer service is beneficial "especially in a contractual relationship." So split your contract buyers from no-contract buyers before you lean on their result.
Four account management metrics, with formulas
Those limits are why we show inputs. Every formula below runs on example inputs from our made-up 12-account book, where starting revenue is last year's sales from the same accounts. Check each result by hand before you swap in figures you've pulled from your own books.
| Metric | Formula | Example inputs | Example result |
|---|---|---|---|
| Net revenue retention (NRR) | (start + expansion - contraction - churned) / start | $1,864,000 + $141,000 - $75,000 - $211,000, over $1,864,000 | 92.2% |
| Gross revenue retention | (start - contraction - churned) / start | $1,864,000 - $75,000 - $211,000, over $1,864,000 | 84.7% |
| Logo churn | accounts lost / accounts at start | 2 / 12 | 16.7% |
| Revenue churn | churned revenue / start | $211,000 / $1,864,000 | 11.3% |
| Customer lifetime value (CLV) | m x r / (1 + d - r) | m $40,742.37 profit after serve, r 0.8333, d 10% | $127,319.91 |
| Cost to serve, account A | hours x wage + tickets x $25 + rush orders x $40 + extra freight | 260 x $36.76 + 48 x $25 + 30 x $40 + $9,800 | $21,757.60 |
Read NRR first. Above 100% means kept accounts grew by more than you've lost, and the example's at 92.2% because two accounts left. In the CLV line, m is yearly profit after cost to serve, r is the share of accounts kept, and d is a 10% example discount rate. The same formula shows why retention moves value so much. At r = 0.8333, the multiple on yearly profit is 3.125. At 0.8833 it's 4.077. That 5-point retention gain lifts example CLV by 30.5%, from $127,319.91 to $166,103.52. Your multiple won't match ours, but because r sits in both the top and bottom of the formula, each extra point of retention is worth more than the last.
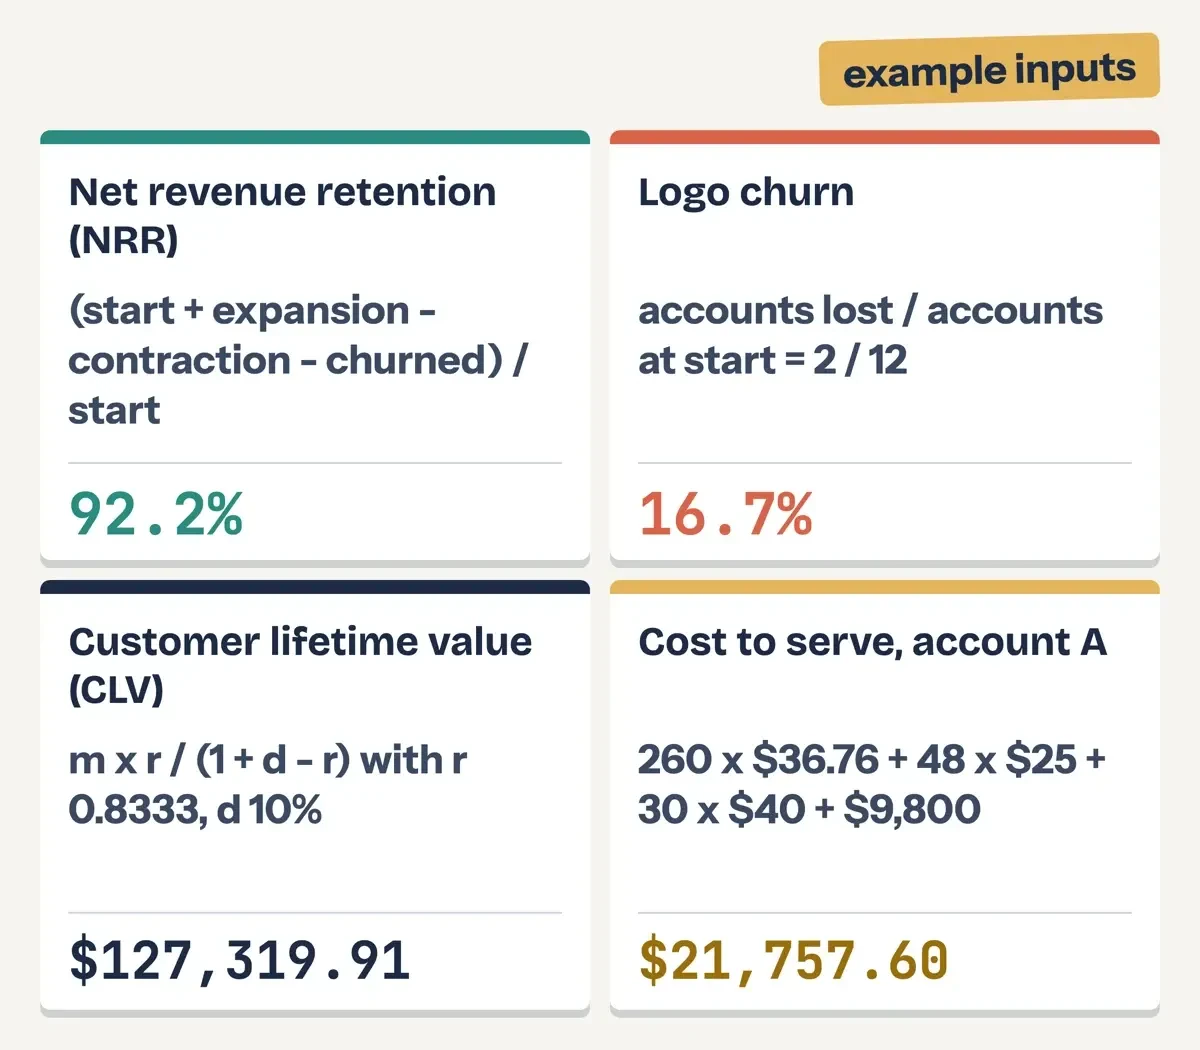 Diagram by DigitalTreed: the four account management formulas with example inputs from our made-up 12-account book.
Build a key account plan around four parts
Homburg, Workman and Jensen built their 2002 model of key account management around "(1) activities, (2) actors, (3) resources, and (4) approach formalization". They found eight approaches across industries, with "significant performance differences among the approaches." A 2003 paper by the same three authors drew on data from 385 firms. Its abstract says firms "should seek to build esprit de corps among those involved in KAM" and should "proactively initiate activities with key accounts". Key account managers also need "access to key resources within the marketing and sales organization", and firms "should involve top managers of the firm."
The six example lines below put those four areas on one account. There's a profit goal on top and quarterly metrics at the end.
- Account goal: profit after cost to serve for the next 12 months, in dollars
- Activities: three to five joint actions planned with the customer this year
- Actors: account owner, executive sponsor, and named service and delivery contacts
- Resources: pricing, service and delivery help the account manager can call on
- Formal rules: review dates, escalation path, and who signs off on special terms
- Metrics: NRR, cost to serve and open issues, checked every quarter
Keep the plan in the account's CRM record. Our CRM setup plan for the first 30 days lists the fields, and the CRM automation workflows post shows how to schedule the quarterly review task.
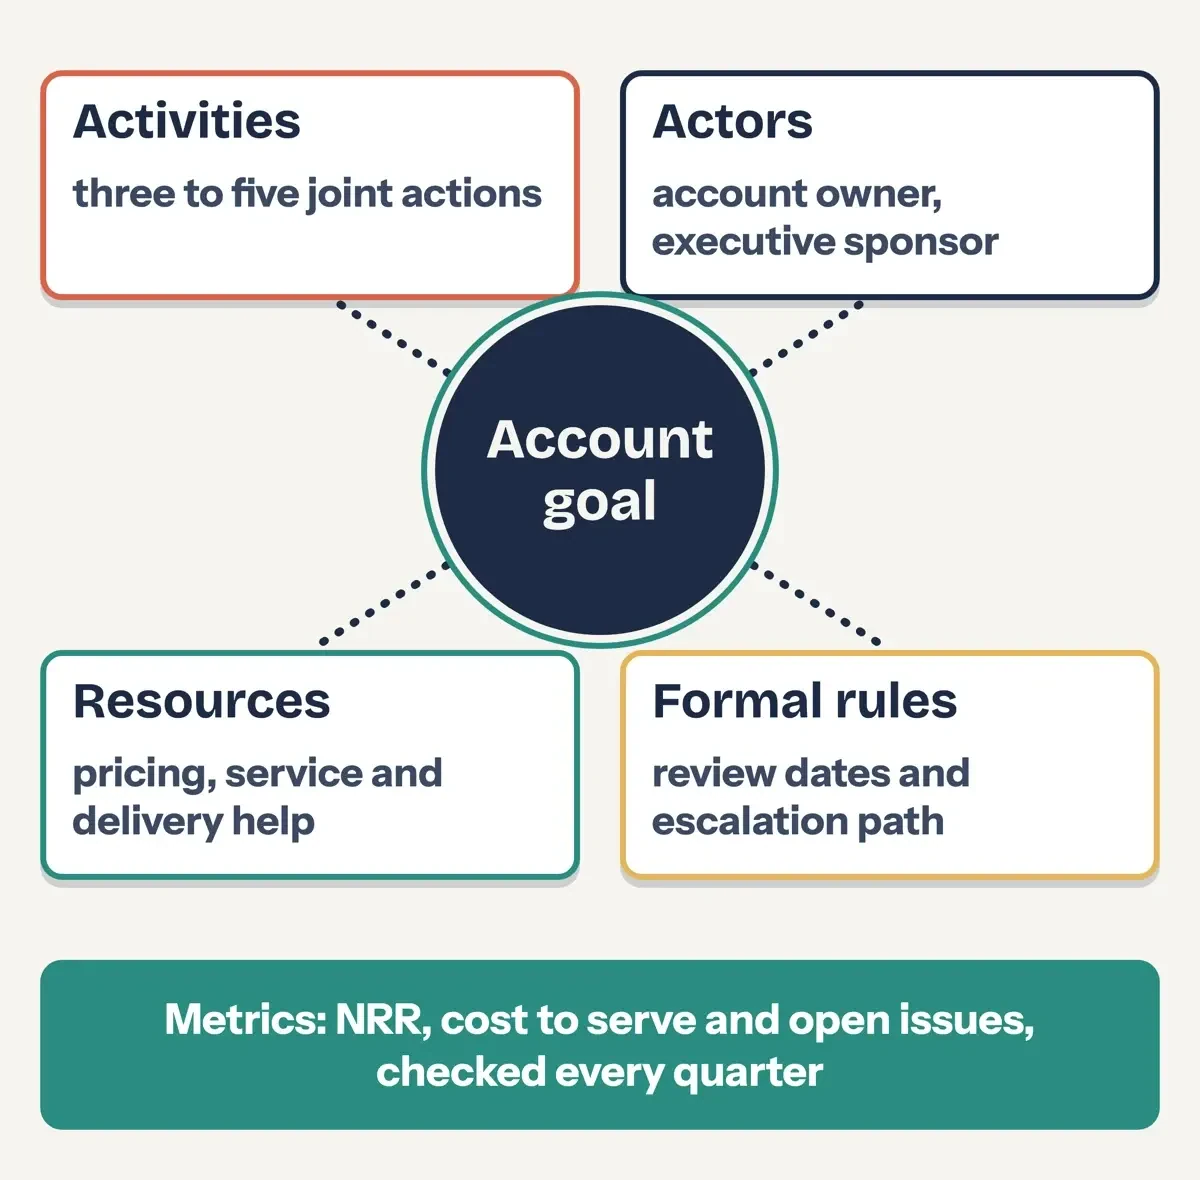 Diagram by DigitalTreed: a key account plan built on the four areas named by Homburg, Workman and Jensen (2002), with example plan lines.
What we tested on a made-up account book
We built a 12-account book for Marrowgate Supply, a made-up Ohio packaging distributor, with two years of revenue, margin, hours, tickets, rush orders and freight. On November 7, 2026, our Python script computed every metric above. The inputs are ours, so it's a demo of the math, not a real book.
Revenue rank vs profit rank in the test book
That script's clearest result came from sorting the same 10 surviving accounts two ways, by 2026 revenue and by profit after cost to serve, and comparing the top three. Five of the 10 are below, with all figures example only.
| Account (made up) | 2026 revenue | Cost to serve | Profit after serve | Serve cost, % of revenue |
|---|---|---|---|---|
| A | $452,000 | $21,757.60 | $77,682.40 | 4.8% |
| B | $301,000 | $6,401.20 | $77,878.80 | 2.1% |
| D | $226,000 | $4,368.40 | $65,691.60 | 1.9% |
| C | $198,000 | $18,284.60 | $29,235.40 | 9.2% |
| H | $64,000 | $7,194.60 | $8,805.40 | 11.2% |
In the example book, the top three by revenue were A, B and D. By profit after cost to serve, B moved past A.
Accounts A, C and H took 53.5% of the 1,038 account hours, yet they brought 41.5% of 2026 revenue and only 28.4% of profit after serve. The two accounts that left, E and J, had received 5.8% of hours the year before.
Example expansion revenue came to $141,000. That's $3.70 per dollar of account manager wages ($38,156.88).
Account A alone made 26.3% of 2026 revenue, a risk our post on diversifying revenue streams covers. If one account passes a quarter of your revenue, we'd give its plan an executive sponsor on both sides before anything else.
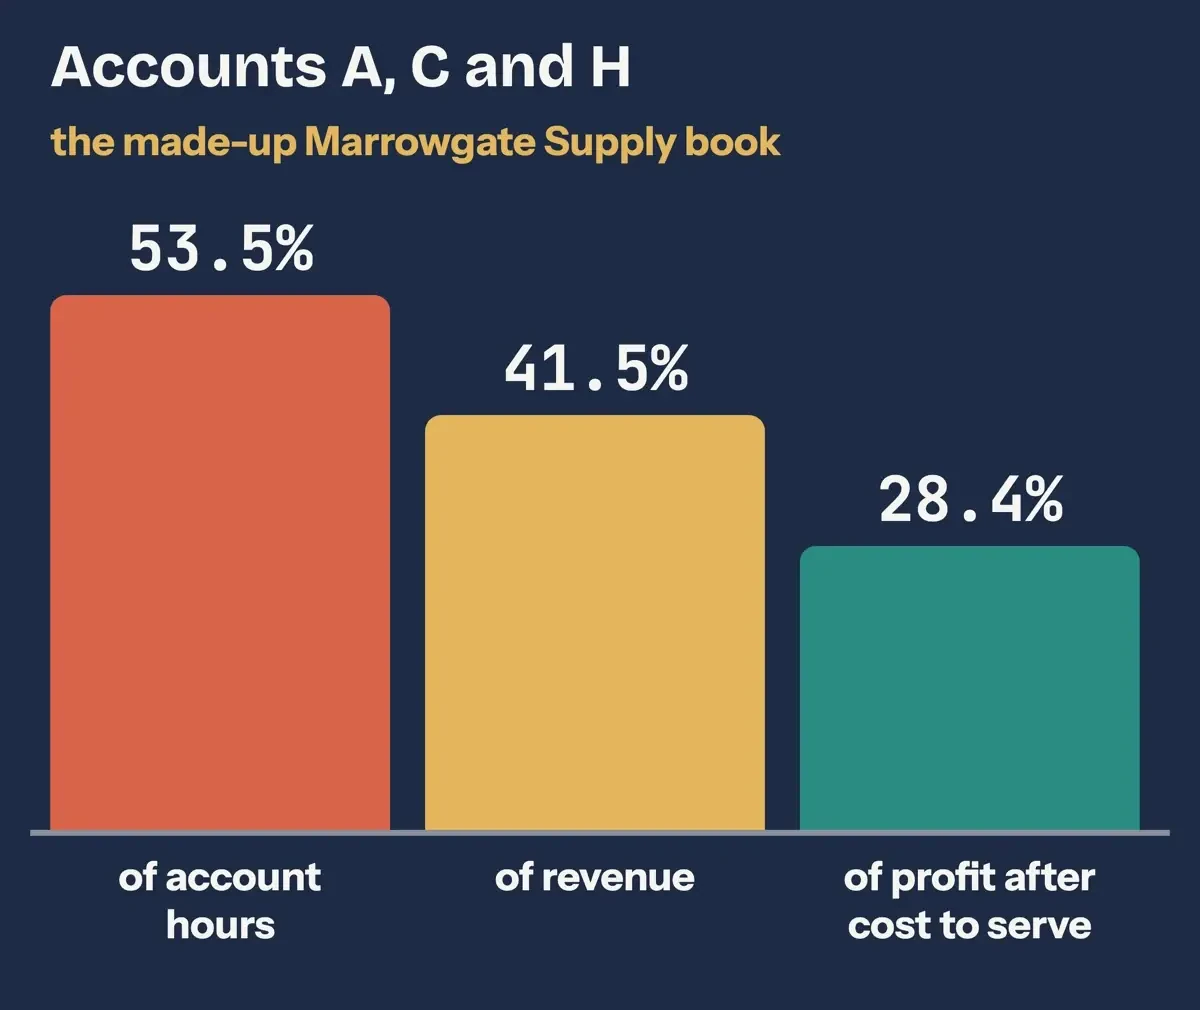 Drawn by us from test/results.json: the made-up Marrowgate Supply book, all figures example only.
Where to put account hours next quarter
So don't read the lost accounts as proof. E and J got 60 of 1,038 hours, but our data's made up, so it can't show that thin coverage caused them to leave.
In your own book, though, it's worth pulling the hours logged on every account you lost last year. If they cluster near zero, that's a pattern you can test with a light quarterly check-in on small accounts.
We'd start with any account whose serve cost passes 9% of revenue (an example cutoff), like C and H in the example book. A rush-order fee, a minimum order or a fixed service schedule may cut those hours, and two quarters of orders will show whether the revenue holds.
You'd move the freed hours to accounts with high margin and room to grow, such as D and I in the example book.
Then rerun the four formulas each quarter, before the plan review. If NRR stays under 100% while serve costs climb, you're putting in more hours while kept revenue shrinks. Our B2B and B2C differences explainer covers why B2B buyers want a named contact.
Frequently asked
What net revenue retention should I aim for?
We found no federal or peer-reviewed benchmark, so track your own quarters. Gupta and coauthors note companies "increasingly derive revenue from the creation and sustenance of long-term relationships".
Is an account manager a sales manager?
Per BLS, "Sales managers plan, direct, or coordinate the delivery of a product or service to the customer". Account managers mostly sit in rep roles.
How many accounts should one account manager handle?
There's no federal standard, so count hours, not accounts. Our example book needed 1,038 account hours for 12 accounts. Venkatesan and Kumar's framework helps managers "allocate marketing resources efficiently across customers".
Do customer service reps do account management?
Partly. BLS says they "interact with customers to handle complaints, process orders, and answer questions", with about 289,500 openings a year projected through 2035.
How we made this guide: Six study abstracts (five Crossref records, one Springer page) and the BLS and O*NET pages were saved November 7, 2026. We've matched each quote against those copies. Facts checked by the DigitalTreed team on November 7, 2026.
First published January 2026 as a general essay with a software product plug and no sources. Rewritten November 7, 2026 with BLS and O*NET role data, six peer-reviewed studies, metric formulas and a made-up account book test. The product plug and the unsourced claims were cut.
Sources
- BLS Occupational Outlook Handbook: Sales Managers
- BLS Occupational Outlook Handbook: Wholesale and Manufacturing Sales Representatives
- BLS Occupational Outlook Handbook: Customer Service Representatives
- O*NET OnLine: Sales Managers (11-2022.00)
- BLS OEWS occupation profile: Sales Representatives of Services (41-3091), May 2025
- O*NET OnLine: Sales Representatives, Wholesale and Manufacturing, Except Technical (41-4012.00)
- O*NET OnLine: Sales Representatives, Wholesale and Manufacturing, Technical (41-4011.00)
- O*NET OnLine: Sales Representatives of Services (41-3091.00)
- O*NET OnLine: Customer Service Representatives (43-4051.00)
- Gupta, Lehmann and Stuart (2004), Valuing Customers, Journal of Marketing Research 41(1)
- Reinartz and Kumar (2000), On the Profitability of Long-Life Customers in a Noncontractual Setting, Journal of Marketing 64(4)
- Venkatesan and Kumar (2004), A Customer Lifetime Value Framework for Customer Selection and Resource Allocation Strategy, Journal of Marketing 68(4)
- Homburg, Workman and Jensen (2002), A Configurational Perspective on Key Account Management, Journal of Marketing 66(2)
- Workman, Homburg and Jensen (2003), Intraorganizational Determinants of Key Account Management Effectiveness, Journal of the Academy of Marketing Science 31(1)
- Gupta et al. (2006), Modeling Customer Lifetime Value, Journal of Service Research 9(2)
- Gupta and Lehmann (2003), Customers as Assets, Journal of Interactive Marketing 17(1)
Comments
No comments yet. Start the conversation below.