

Quick answer
Marketing budgets, B2B and consumer alike, averaged 7.8% of company revenue in Gartner's 2026 CMO Spend Survey, as of May 2026. Most of its 401 respondents work at firms earning over $1 billion, so a small B2B firm may start lower. Our example $5,000 month is 2% of $3 million. Pick a percent, divide by 12, then split it by channel.
Say your bank asks what marketing will cost next year. A B2B marketing budget is the money a company selling to other businesses sets aside for a year of marketing: people, ads, tools and events. We'd set it from revenue first.
This guide takes one made-up firm with $3 million in revenue from a survey benchmark to a daily ad budget. You'll get the revenue formula, two example months, the Google and LinkedIn daily rules, our calculator results and a quarterly review.
Key takeaways
- Gartner's 2026 average of 7.8% comes mostly from firms earning over $1 billion.
- Monthly budget equals yearly revenue times your percent, divided by 12.
- Our example $5,000 month is under one month of BLS median analyst pay.
- LinkedIn ads need a daily budget of at least $10.
- Google Ads can spend up to twice your daily budget on one day.
What do B2B companies spend on marketing?
We start from Gartner's number. Its 2026 CMO Spend Survey release puts marketing budgets at 7.8% of company revenue in 2026, up from 7.7% in 2025. The survey covered 401 CMOs and other marketing leaders from January through March 2026. Gartner says the vast majority report annual revenue of over $1 billion, and they work across different industries in North America, the United Kingdom and Europe. So the group isn't only B2B sellers. Groups with mature AI readiness reported 8.9% of revenue, and CMOs put an average of 15.3% of marketing budgets into AI initiatives. Even at that size, 56% of CMOs say they lack the budget to deliver their 2026 strategy. And 54% report insufficient resources.
For a $3 million firm, 7.8% shows what much bigger companies spend. We hold our examples up against it. The $20,000 example month is 8.0% of revenue, just above it, and the $5,000 example month is 2.0%, about a quarter of it.
For a sample with more small firms, there's the Content Marketing Institute's B2B trends report for 2026. It surveyed 1,015 B2B marketers, mostly in North America, between June 24 and August 14, 2025, in research run with MarketingProfs and sponsored by Storyblok. Of those, 22% work at companies with 1 to 9 employees and 24% at 10 to 99. That's 22% + 24% = 46% at firms under 100 employees. CMI no longer splits results by budget. So it shows where B2B money goes but doesn't say what share of revenue it takes. If you haven't settled whether your firm sells like a B2B or a consumer brand, start with our explainer on how B2B and B2C marketing differ.
Turn a percent of revenue into a monthly number
Once you've picked a percent, the math is one line: yearly revenue times the percent, divided by 12. Write the formula next to the result so a partner, a banker or your own team can redo it, as the table below does.
| Yearly revenue (example) | 2% (our low example) | 5% (our middle example) | 7.8% (Gartner's 2026 average) |
| $1,000,000 | $1,666.67 a month | $4,166.67 a month | $6,500 a month |
| $3,000,000 | $5,000 a month | $12,500 a month | $19,500 a month |
| $10,000,000 | $16,666.67 a month | $41,666.67 a month | $65,000 a month |
Neither 2% nor 5% comes from a survey; we've picked them as a low and a middle setting. The Gartner column climbs fastest. $3,000,000 x 7.8% / 12 = $19,500 a month, against $6,500 at $1 million and $65,000 at $10 million.
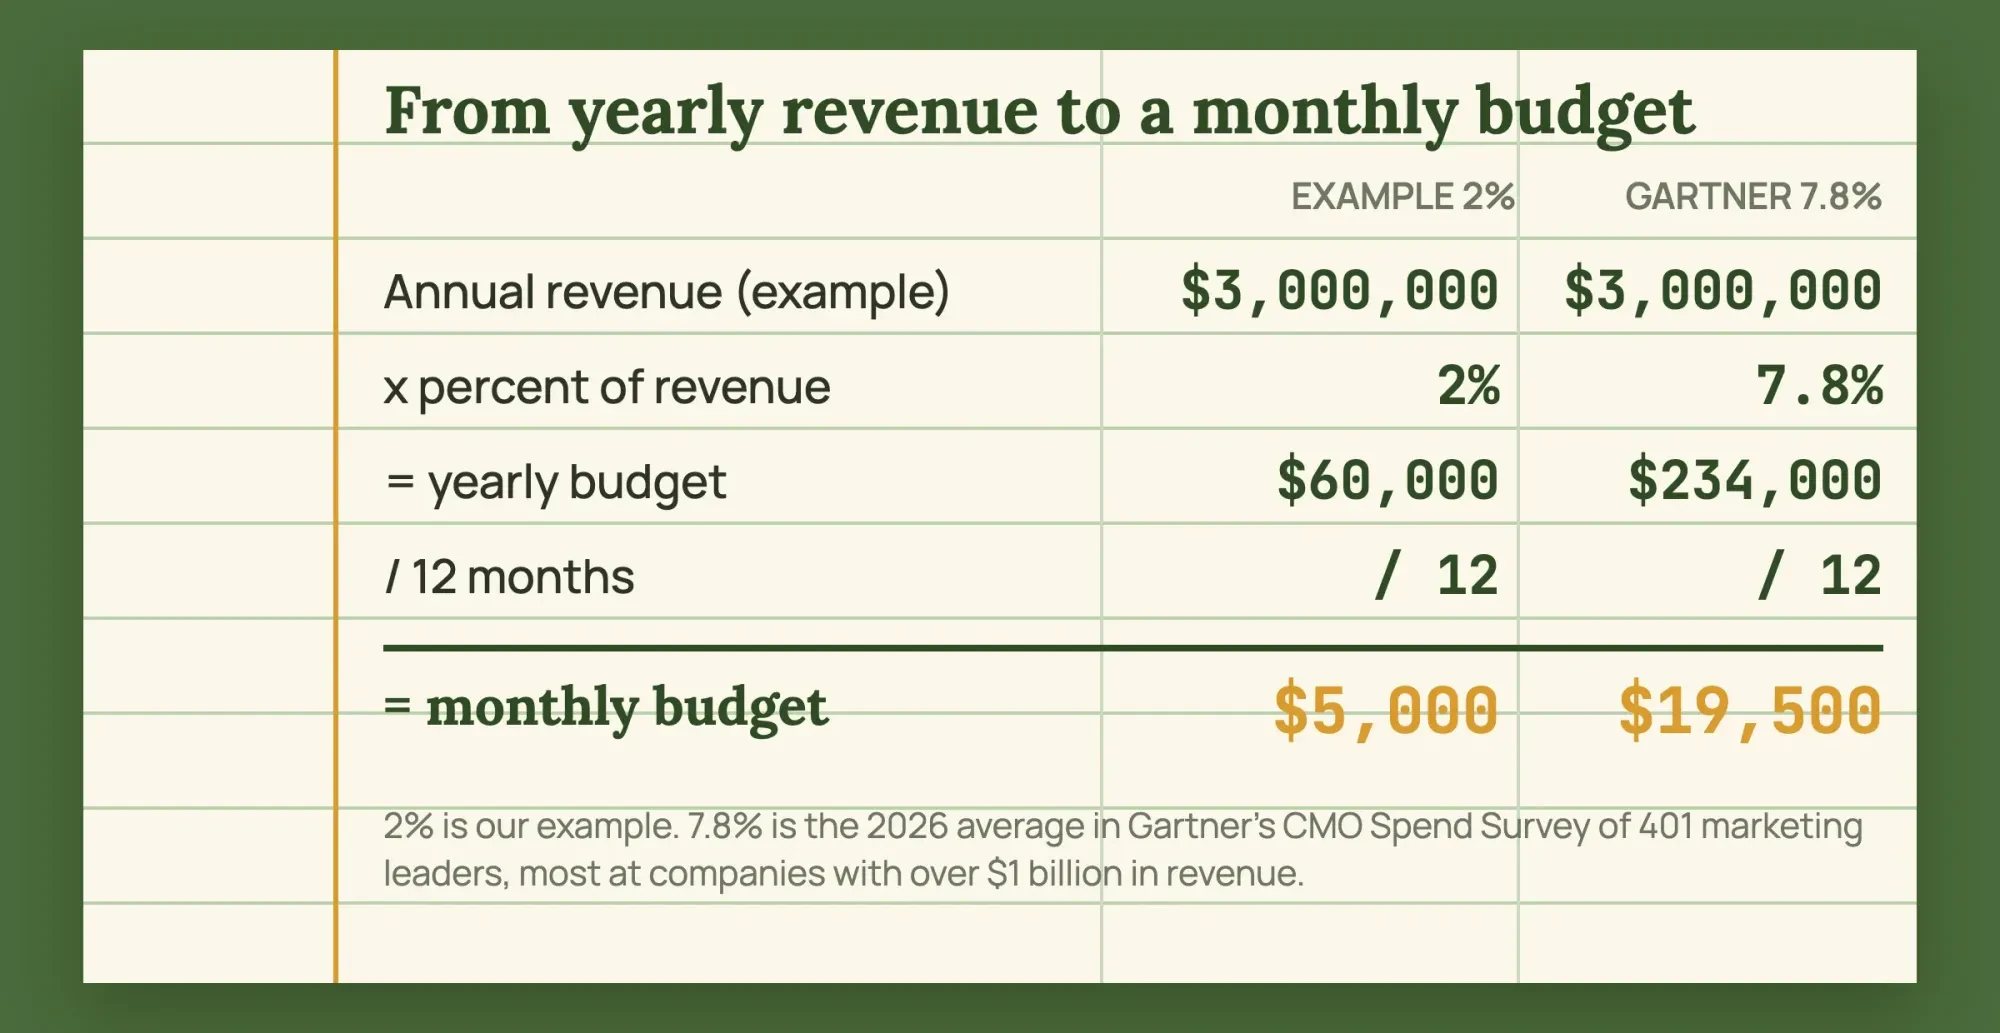 Diagram by DigitalTreed. Example revenue; 7.8% from Gartner's 2026 CMO Spend Survey release.
The people line is where small budgets run out first. The BLS Occupational Outlook Handbook page for market research analysts gives a median annual wage of $78,760 in May 2025. That's $78,760 / 12 = $6,563.33 a month before benefits and payroll taxes. That's more than our whole $5,000 example month, so hiring one full-time person needs a far bigger budget. At that size, the hands-on work comes from freelancers, an agency or someone already on staff. Our breakdown of what digital marketing agencies charge shows how those fees are set up. Big firms watch them too: in Gartner's 2025 survey of 402 marketing leaders, 39% of CMOs planned to cut agency budgets, and 39% wanted to cut labor spending.
Where B2B marketing money goes
Before you split your own number, look at how bigger budgets break down, because the categories carry over to a small firm even when the dollars don't. Gartner's 2025 CMO Spend Survey release, based on 402 marketing leaders, found paid media took 30.6% of marketing budgets. That's 2.4% of company revenue. Then spending moved toward people. The 2026 survey's media spend release, covering the same 401 leaders, says labor's share of the budget rose from 21.9% in 2025 to 24.5% in 2026. Digital channels now make up more than two-thirds of media spend there in 2026, up 18% since 2024. Awareness and conversion take 62.6% of media spend, while loyalty and retention fell to less than 15%.
In the CMI 2026 report, 78% of B2B marketers said they budgeted for experiential marketing in 2025. When the same 1,015 marketers picked their top three areas for more spending in 2026, CMI listed all 11 answers in this order:
- AI-powered marketing tools: 45%
- Events and experiential marketing: 33%
- Owned media such as content, website, blog and email: 32%
- Paid media: 25%
- Content personalization: 24%
- Tech infrastructure such as martech, analytics and CRM: 21%
- Social and earned media: 20%
- Agency or outsourcing: 19%
- Research and insights: 15%
- First-party data capabilities: 12%
- Human resources, meaning salaries, training and development: 9%
Our example months draw on that same list, with one change. A small firm with no marketing staff would pay people through freelancers or an agency, not a payroll line. In our split, that cost sits inside each channel line.
Two example months for a made-up fastener distributor
Here's that split for Ironbridge Fasteners, a made-up distributor that sells bolts and anchors to contractors and plants across its region, with $3 million in yearly revenue. Both months are examples; each line is the budget times its share, divided by 100.
| Channel | Example A share | Example A: $5,000 month | Example B share | Example B: $20,000 month |
| SEO and content | 35% | $1,750 | 30% | $6,000 |
| Paid search | 25% | $1,250 | 25% | $5,000 |
| 18% | $900 | 20% | $4,000 | |
| Events | 12% | $600 | 15% | $3,000 |
| 10% | $500 | 10% | $2,000 | |
| Total | 100% | $5,000 (2.0% of revenue) | 100% | $20,000 (8.0% of revenue) |
We ordered the shares around how a distributor's buyers behave in our example. They look up part numbers and specs before they call. A page written once keeps answering those searches after the month you paid for it ends, so SEO and content get the biggest share in both of our example months. Paid search catches this week's urgent orders. LinkedIn reaches purchasing managers by job title. Events pay for one regional trade show or plant visit day, and email, at 10% in both months, keeps quote requests from going cold. We didn't give social media its own line, since LinkedIn covers the buyers this firm sells to. Our 15 email examples for small businesses show what to send.
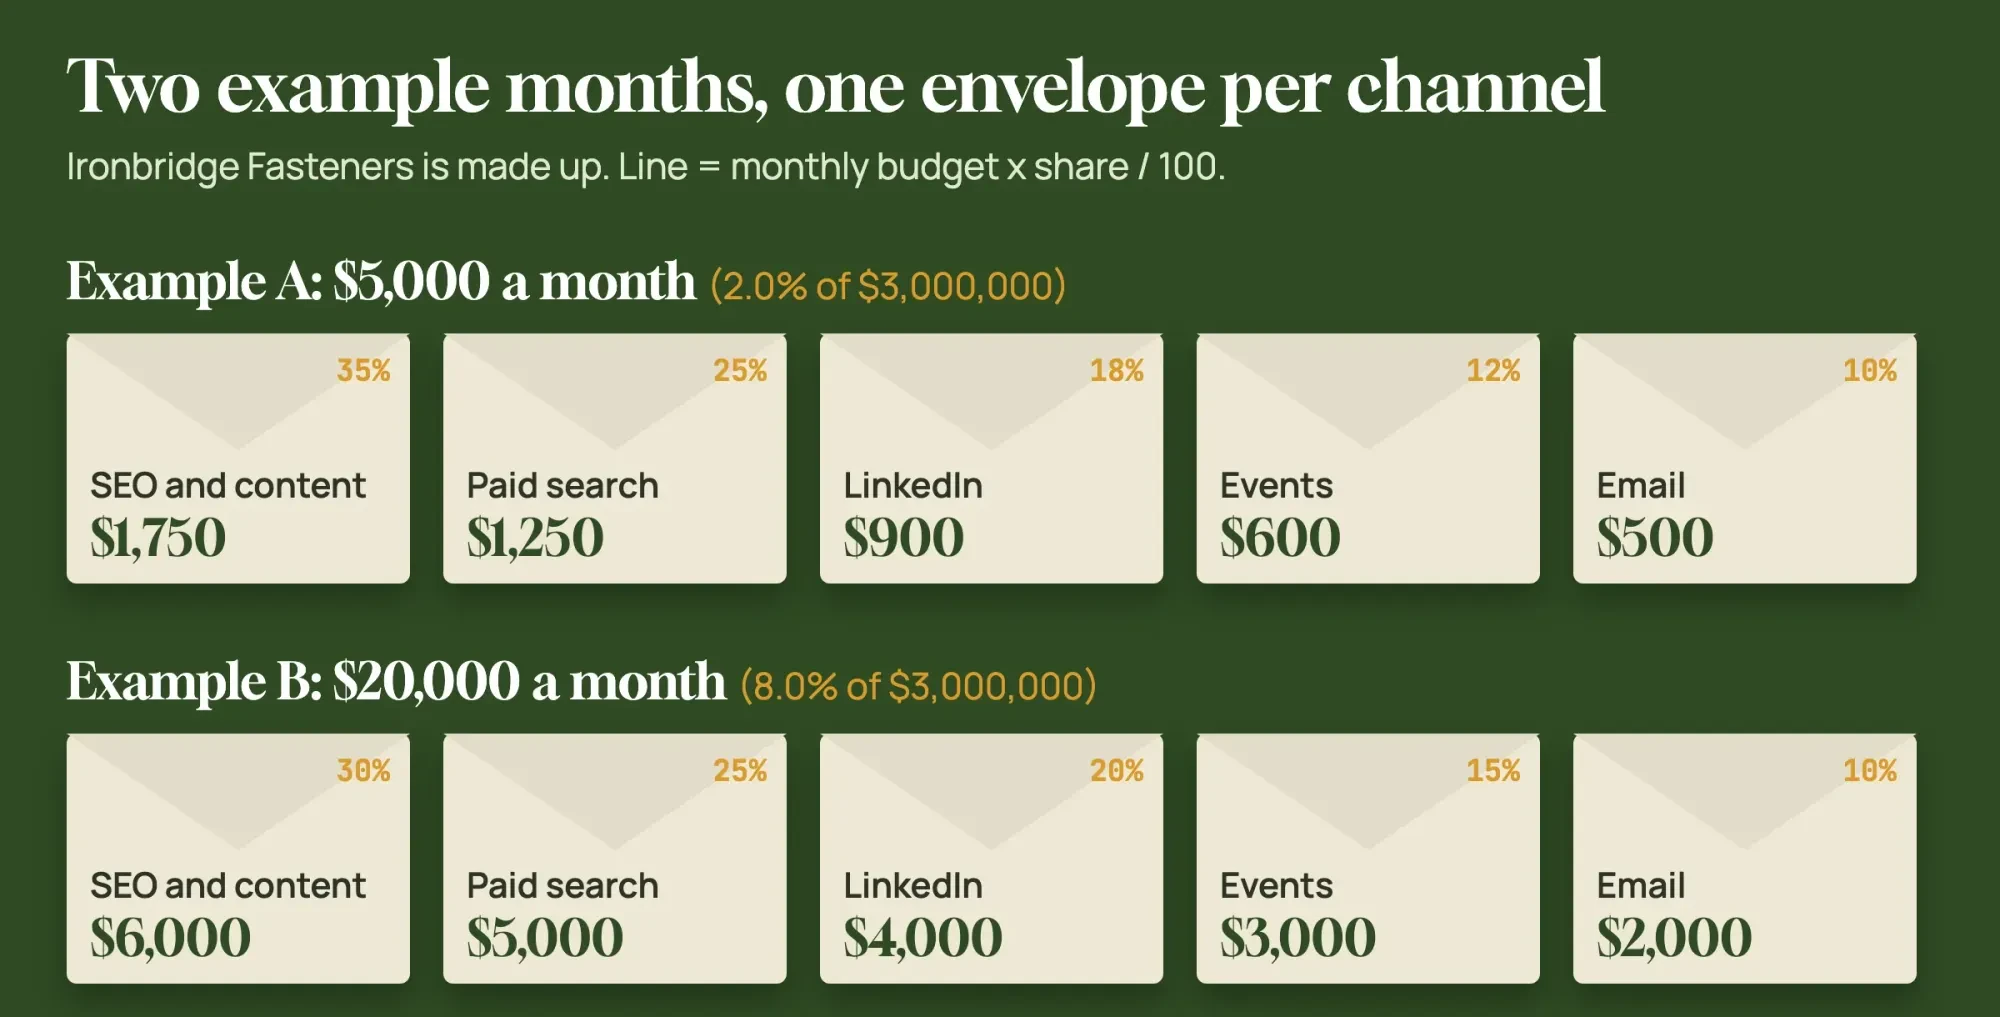 Drawn by us. Example split for Ironbridge Fasteners, a made-up company; line = monthly budget x share / 100.
Example A comes to $5,000 x 12 = $60,000 a year, which is 2.0% of the $3 million in yearly revenue. Example B is $240,000 a year, or 8.0%. That's just above Gartner's 7.8% average on the same revenue, so it shows what the big-company benchmark buys at a small company's scale. At Gartner's 2026 AI-ready figure of 8.9%, the same firm would spend $22,250 a month. The events shares of 12% and 15% sit inside the 11 to 30% band that 26% of CMI's respondents picked. Before you commit to the SEO line, our SEO ROI calculator turns target rankings into a low-to-high range. For the channels that suit plants and job shops, see our marketing for manufacturers guide.
Ad platforms set daily floors and caps
A monthly line only works if the platform spends it as planned. Both platforms budget by the day. As of October 2026, Google Ads Help, on choosing a bid and budget, says to multiply the daily budget by 30.4 for a monthly figure.
That help page adds that spend will never exceed 2 times your average daily budget on a given day. For Example A's paid search line, $1,250 / 30.4 = $41.12 a day. One busy day could reach $82.24. The month still balances, though, because Google's average daily budgets page sets a monthly spending limit of 30.4 times the average daily budget for most campaigns. It also lets you set and edit that daily budget at any time, so you can trim a slow week without rewriting the plan. Set the daily figure from the monthly line, then adjust it once you've seen the leads. Our PPC marketing guide explains bids and match types if paid search is new to you.
LinkedIn's rule is a floor instead. Its budget best-practices page says, as of October 2026, that the minimum daily budget to start is $10, "for any ad format." Once a campaign launches, its minimum lifetime budget becomes that $10 times the number of days scheduled, so a 30-day run needs at least $300 in total. LinkedIn recommends a lifetime budget with lifetime pacing, which spreads spend across each week. Under "Defaults," it says "we suggest $25 for new advertisers" who pay in USD, but the page doesn't say per day. We read it as daily, the stricter reading. Example A's LinkedIn line is $900 / 30.4. That's $29.61 a day, which clears both the floor and the $25.
That's where smaller budgets get squeezed. Our Example C is a made-up $1.2 million company spending $2,000 a month. The same 18% share gives it $360 / 30.4 = $11.84 a day, above the floor but under the $25 read as daily. One fix is to run fewer days: the same $360 over 14 days is $25.71 a day, with a lifetime minimum of $10 x 14 = $140. You'd then reach buyers for two weeks of the month. LinkedIn's ad pricing page adds that costs depend on the ad auction and on the billable event your campaign objective sets, such as a click to your website. So the same daily figure can buy different reach from one month to the next.
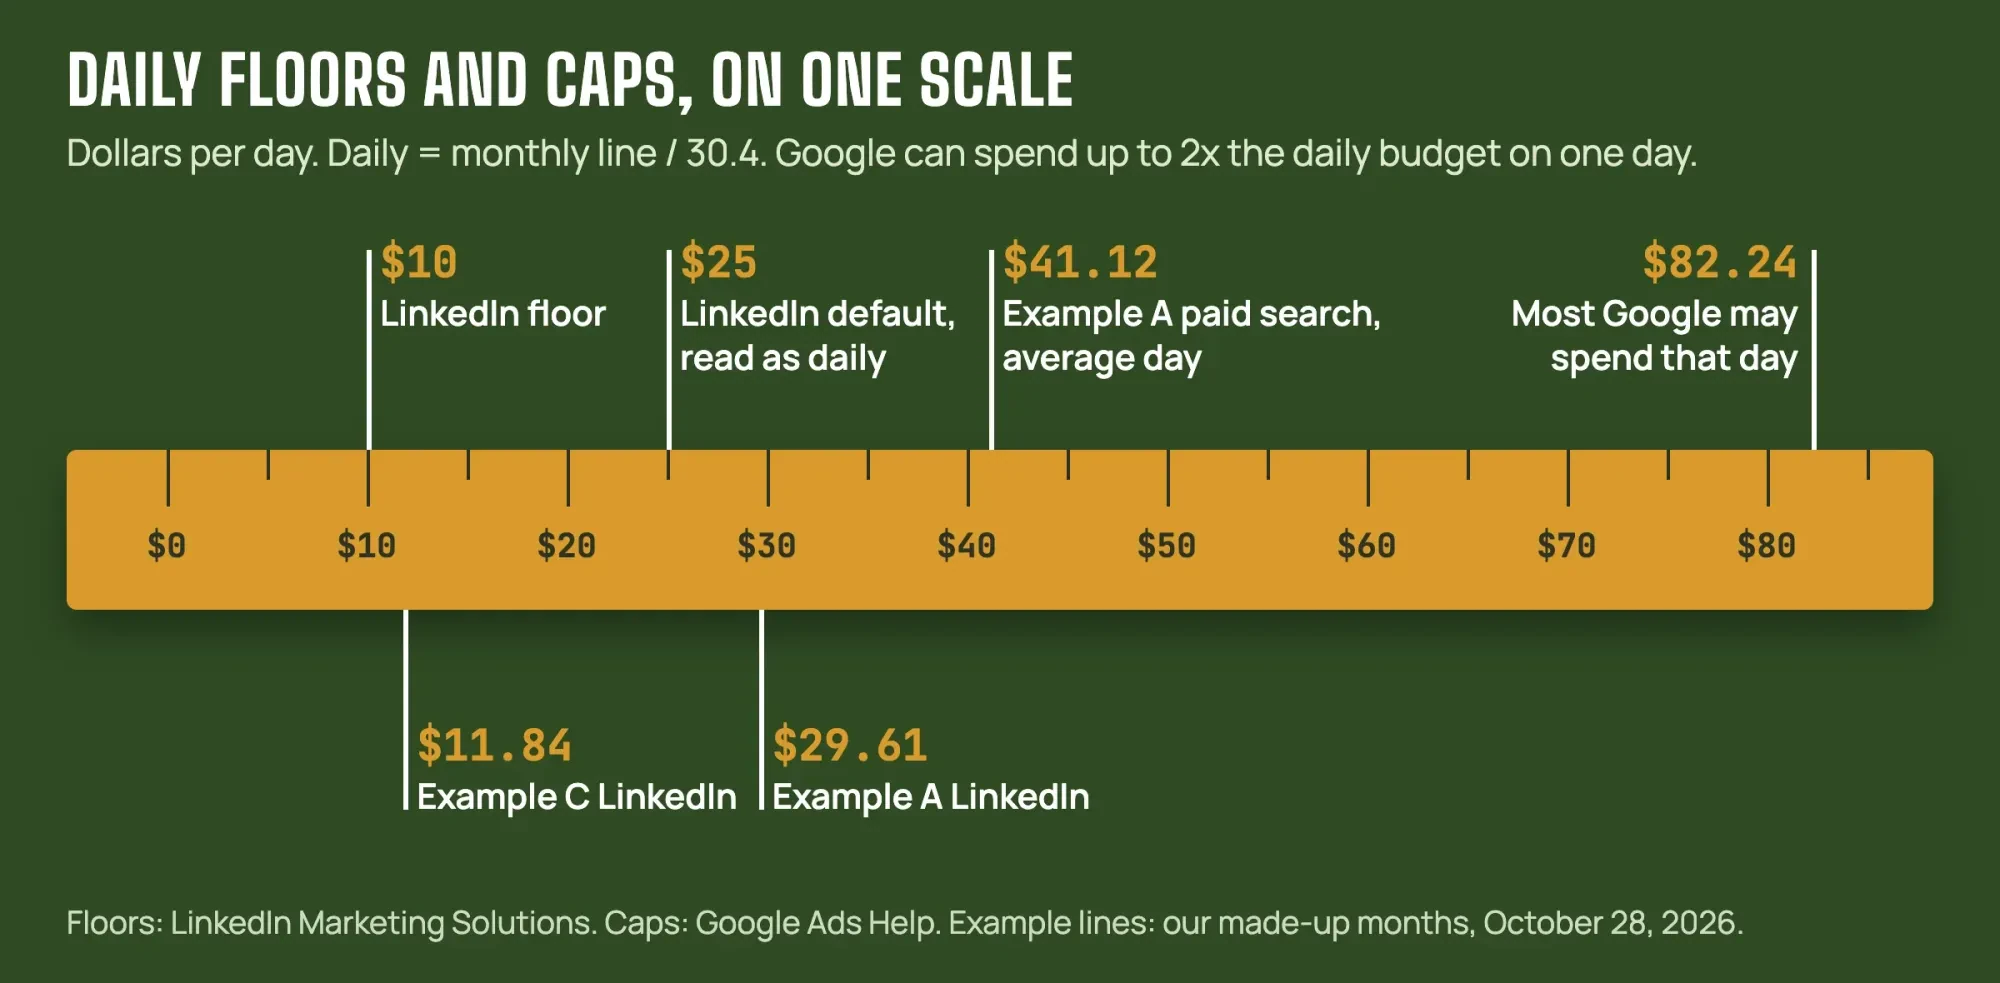 Diagram by DigitalTreed. Floors from LinkedIn and caps from Google Ads Help, both read October 28, 2026; example lines are made up.
Three test budgets run through our calculator
Every daily number above came out of our calculator. Here are all its results for the three made-up budgets, with peaks worked from unrounded figures. All three splits added to 100%, and all three LinkedIn days cleared the $10 floor. Example A came to 2.0% of revenue, with $41.12 a day for paid search, $82.24 on a peak day and $29.61 for LinkedIn. Example B came to 8.0%, with $164.47, $328.95 and $131.58. Example C came to 2.0%, with $16.45, $32.89 and $11.84. Only Example C missed LinkedIn's $25, read as daily. Only Example B covered one month of BLS median pay. Gartner's 7.8% on the same revenue came to $19,500 for A and B and $7,800 for C.
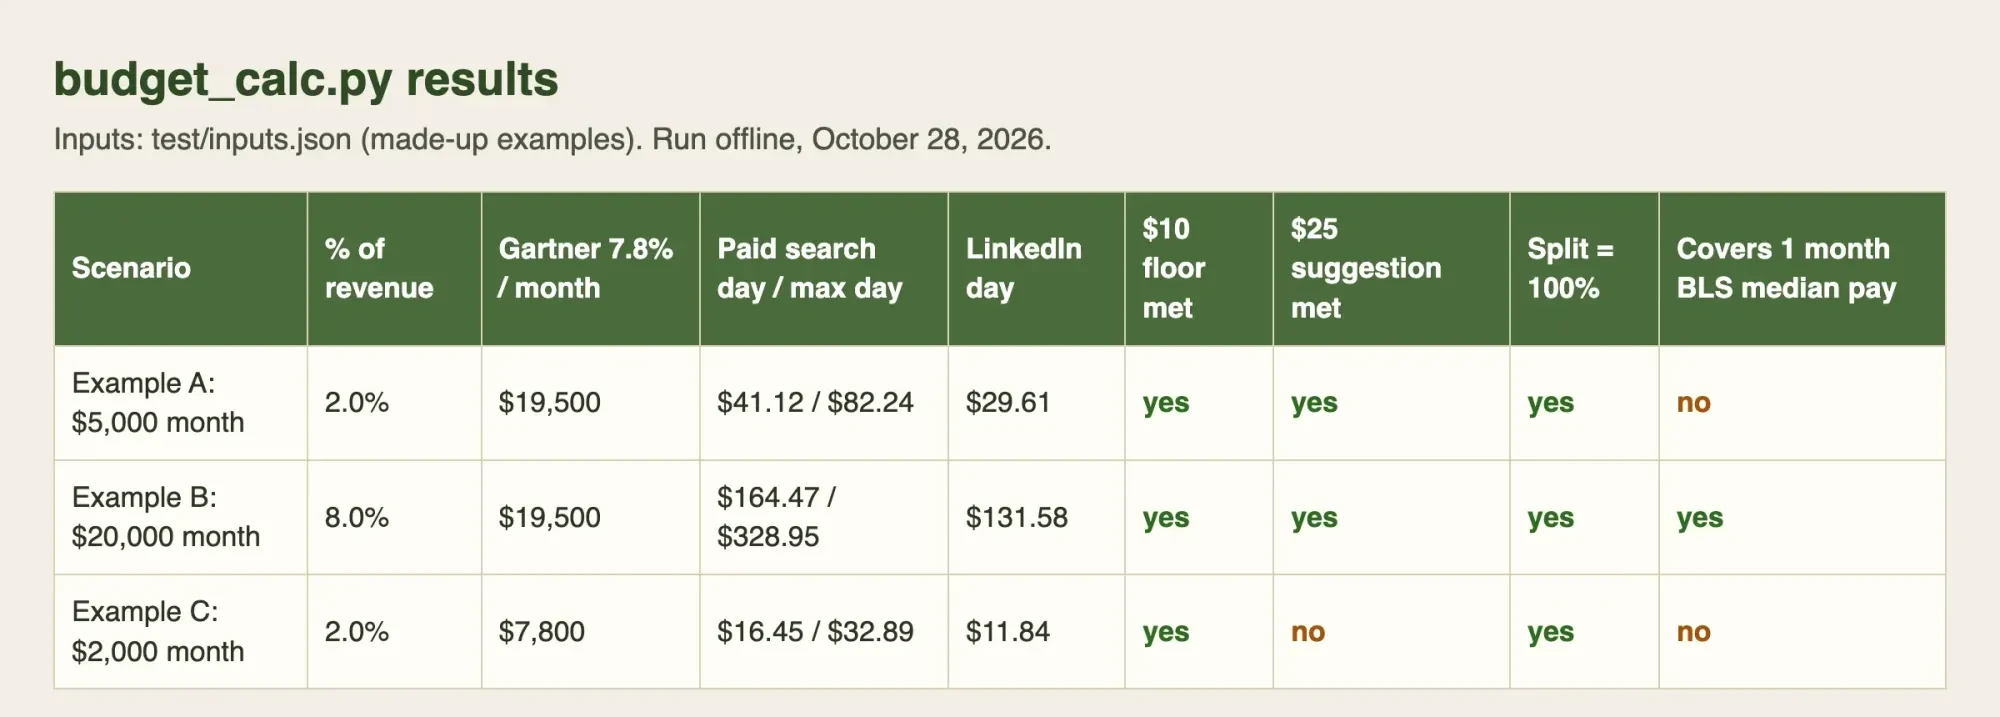 Screenshot: budget_calc.py output shown as a local page at 127.0.0.1, October 28, 2026. Inputs are made up.
What we tested
We wrote budget_calc.py and ran it offline on a Mac on October 28, 2026, using Ironbridge's two months and Example C. It doesn't forecast leads or clicks, and we didn't run any ads. It runs six checks, no others:
- The split adds to 100%.
- Percent of revenue, beside Gartner's 7.8%.
- Each channel line in dollars.
- The paid search day and its 2x peak.
- The LinkedIn day against $10 and $25.
- The month against one month of BLS median pay.
The script reads inputs.json, where every revenue, budget and share is made up, and writes out.txt and results.json. A rerun gave identical files. A second script, make_results_page.py, lays that JSON out as the page in the screenshot, without changing any number.
Review the split every quarter
Put the first quarterly review on the calendar before any ad runs. Tag every link in your ads, emails and LinkedIn posts with UTM parameters, or let the UTM builder we made write them. Next, log each lead's source in your CRM. Decide up front what'll count as a qualified lead, such as a quote request with a part number and a quantity, and use that rule for every channel. If a source can't be tagged, like a contact from a trade show, enter it by hand with the event's name. After 90 days, divide each channel's spend by the qualified leads it brought in, and you'll have a cost per lead you can compare across every line.
Our take: for the first two quarters, move money between lines rather than changing the total, and halve the share of any paid line that brought no qualified leads. Give the difference to whichever channel had the lowest cost per qualified lead that quarter. We'd give SEO and content two quarters before judging them, because a new page has to be crawled and ranked before it can send anyone a lead. Our piece on how SEO generates leads explains where those leads come from. If two lines tie, keep the one whose leads turned into orders, because a qualified lead that never buys still cost you money. Change the total only at the yearly review.
DigitalTreed sells SEO, content and ad management, so we'd be paid if one of these lines came to us. You can run all of this without us, and our project quote estimator prices a single line in USD.
B2B marketing budget questions
Frequently asked
Is a marketing budget tax deductible?
IRS Publication 334 lists advertising among expenses you can deduct, if the expense is "both ordinary and necessary." Ask your CPA how yours fits.
What share of a B2B budget goes to events?
In CMI's 2026 B2B survey, 13% of B2B marketers put 31 to 50% of their budget into experiential marketing, and 4% put in more than half.
How much should I spend on LinkedIn ads at first?
LinkedIn's budget page sets a $100 minimum lifetime budget for new, inactive campaigns. For existing advertisers using USD, it suggests $50-100.
Do B2B marketing budgets go up every year?
In CMI's outlook for 2025, which surveyed 980 B2B marketers, 46% of those who knew their content budget expected it to grow, and 8% expected a cut.
How we made this guide: This guide draws on three Gartner releases, two CMI reports and the Google, LinkedIn, BLS and IRS pages linked above. A local script with made-up inputs gave the example months and daily figures. Facts checked by the DigitalTreed team on October 28, 2026.
First published May 2022 as a list of B2B marketing benefits. Rewritten October 28, 2026: now a budget guide with survey benchmarks, a formula, two example months, ad platform limits and a local calculator test.
Sources
- Gartner: 2026 CMO Spend Survey press release (May 11, 2026)
- Gartner: 2026 CMO Spend Survey media spend release (June 8, 2026)
- Gartner: 2025 CMO Spend Survey press release (May 12, 2025)
- Content Marketing Institute: B2B Content and Marketing Trends, Insights for 2026
- Content Marketing Institute: B2B Content Marketing Benchmarks, Budgets, and Trends, Outlook for 2025
- Google Ads Help: Choose your bid and budget
- Google Ads Help: About average daily budgets
- LinkedIn Marketing Solutions: Making the most of your budget
- LinkedIn Marketing Solutions: How much do LinkedIn ads cost?
- U.S. Bureau of Labor Statistics: Market Research Analysts, Occupational Outlook Handbook
- IRS: Publication 334, Tax Guide for Small Business

Comments
No comments yet. Start the conversation below.