
Quick answer
For two adults, a weekly grocery cap built on USDA's Thrifty Food Plan comes to $145.42 (September 2026 costs, our example household). At USDA's Moderate-Cost level, the same two people come to $186.45 a week. Pick the level closest to what you spend now, then compare unit prices on shelf tags to stay under that number.
You've watched the grocery total creep up all year, and you'd like one number to aim for. These grocery budget tips start there. A grocery budget is a set dollar amount you plan to spend on store food each week. This guide explains the rules; it isn't financial advice. Ask your state's weights and measures director about unit price rules, and your state or local SNAP office about help paying for food.
First comes the shelf tag: reading the unit price, checking whether bigger packages cost less per ounce, and handling different units or a sale sign. Then we set a weekly cap from the USDA food plans, keep it current as grocery prices move, and cover what to do when the cap doesn't cover food. We'd set the number before the next trip; the shelf sections come first here only because they're what you use in the aisle.
Key takeaways
- A Thrifty-plan cap for two adults was $145.42 a week (September 2026, example).
- USDA's plan costs assume every meal and snack is made at home.
- Example tags, October 2026 test: family-size cereal cost 30.8 cents an ounce; small, 29.1.
- No federal rule requires unit prices; NIST lists 10 mandatory jurisdictions (October 2026).
- Grocery prices rose 1.8% from September 2025 to September 2026; eggs fell 20.6%.
How to read the unit price on a shelf tag
The unit price is the small number on the tag, and it does the comparing for you. NIST, the agency behind U.S. weights and measures guidance, defines it in its Unit Pricing Guide (June 2025). "Unit pricing is the cost per unit of measure of products, such as the cost per milliliter or per ounce."
The math is one division. Divide the shelf price by the size. An example family-size box of Oat Rings, a made-up cereal, at $6.29 for 20.4 ounces works out to 30.8 cents per ounce.
For stores that post unit prices, NIST publishes one model rule that states can adopt. NIST's Uniform Unit Pricing Regulation (Handbook 130, 2026 edition) says every package size of a product "shall be uniformly and consistently expressed" in one unit. That unit can be the ounce, pound, fluid ounce or count, and Section 6 lets the tag show metric units beside U.S. ones. Section 4 sets the rounding. A unit price of a dollar or more goes to the nearest cent. Under a dollar, it goes to the tenth of a cent or the whole cent, never both in one store. So one shop's tag can read 30.8 cents while another's reads 31 cents for the same box.
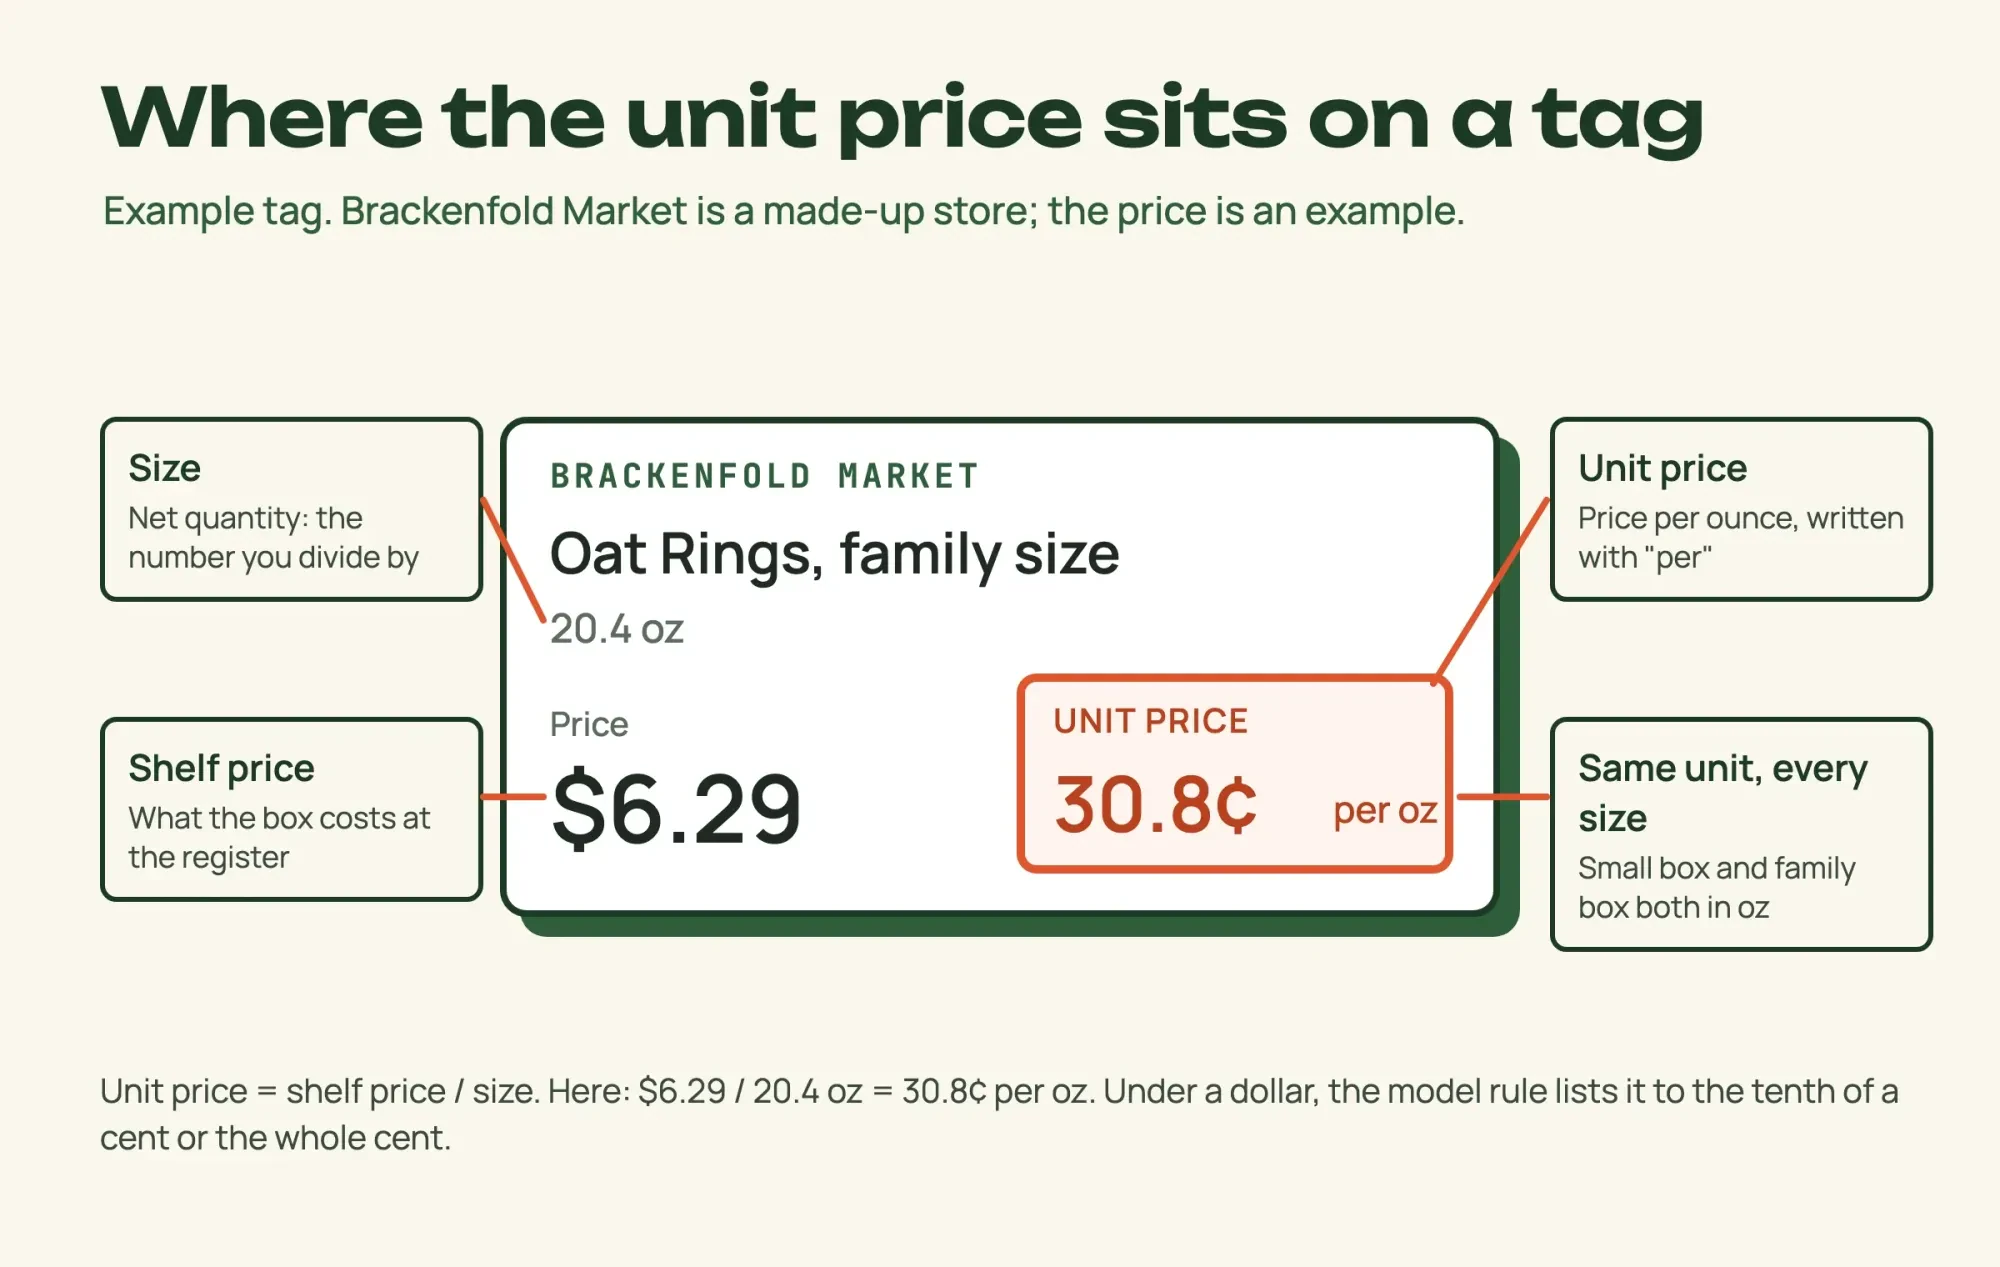 Drawn by us: an example tag with the four parts the NIST unit pricing rule names, values from our October 2026 test.
Expect it to be printed smaller than the price. NIST's guide says its font "should not be less than 50 % of the retail price font size" and not less than 0.24 inches (6 mm). NIST's guide also says the label "should appear directly below or above the commodity" on the shelf. If you can't find it, look at the shelf edge under the box you're holding. Federal law backs the idea without requiring the tag. The Fair Packaging and Labeling Act, 15 U.S.C. 1451 says package labels "should facilitate value comparisons." Before you trust a gap, check that both tags use the same unit, such as "per oz," since a per-pound tag beside a per-ounce one won't compare.
Does the bigger package always cost less per ounce?
Not always, and the package labels in our test show why. We gave a small script six pairs of example shelf tags from Brackenfold Market, a made-up store. It divided every price by its size, and the bigger package lost twice. Here are all six results, with every price an example:
| Item | Option A (example) | Option B (example) | Lower unit price |
| Oat Rings cereal | Oat Rings, small, 12 oz: $3.49, 29.1 cents per oz | Oat Rings, family size, 20.4 oz: $6.29, 30.8 cents per oz | Smaller size |
| Long grain rice | Name brand, 2 lb bag: $4.79, 15.0 cents per oz | Store brand, 5 lb bag: $6.99, 8.7 cents per oz | Larger size |
| Peanut butter | Jar, 16 oz: $2.89, 18.1 cents per oz | Jar, 40 oz: $6.49, 16.2 cents per oz | Larger size |
| Orange juice | Carton, 52 fl oz: $3.99, 7.7 cents per fl oz | Jug, 1 gallon: $6.49, 5.1 cents per fl oz | Larger size |
| Spaghetti | Box, 16 oz (sale: 2 for $5.00): $2.50, 15.6 cents per oz | Box, 32 oz (regular price): $2.79, 8.7 cents per oz | Larger size |
| Large eggs | Carton, 12 count: $2.99, 24.9 cents per count | Carton, 18 count: $4.69, 26.1 cents per count | Smaller size |
Cereal and eggs are the two that flipped. The family-size Oat Rings came to 30.8 cents an ounce against 29.1 cents for the small box. Eggs did the same: 26.1 cents each in the 18-egg carton, 24.9 in the dozen. In the other four pairs the bigger size won, by 10% (peanut butter) to 44% (spaghetti) per unit. Every figure there came from the same formula, shelf price divided by size in one common unit, so it's like for like within each pair. The rice pair changes brand and size at once, so it can't say store brands cost less in general. NIST's guide does say "Unit pricing promotes and increases sales of private-label products by showing value."
Two of six is a small sample, and your shelf won't match ours. On our six made-up pairs, the 12 oz cereal box and the dozen eggs beat their bigger versions by 1.7 and 1.2 cents a unit. On your shelf, read both unit prices before the bigger box goes in the cart, since the size word on the box isn't part of the math.
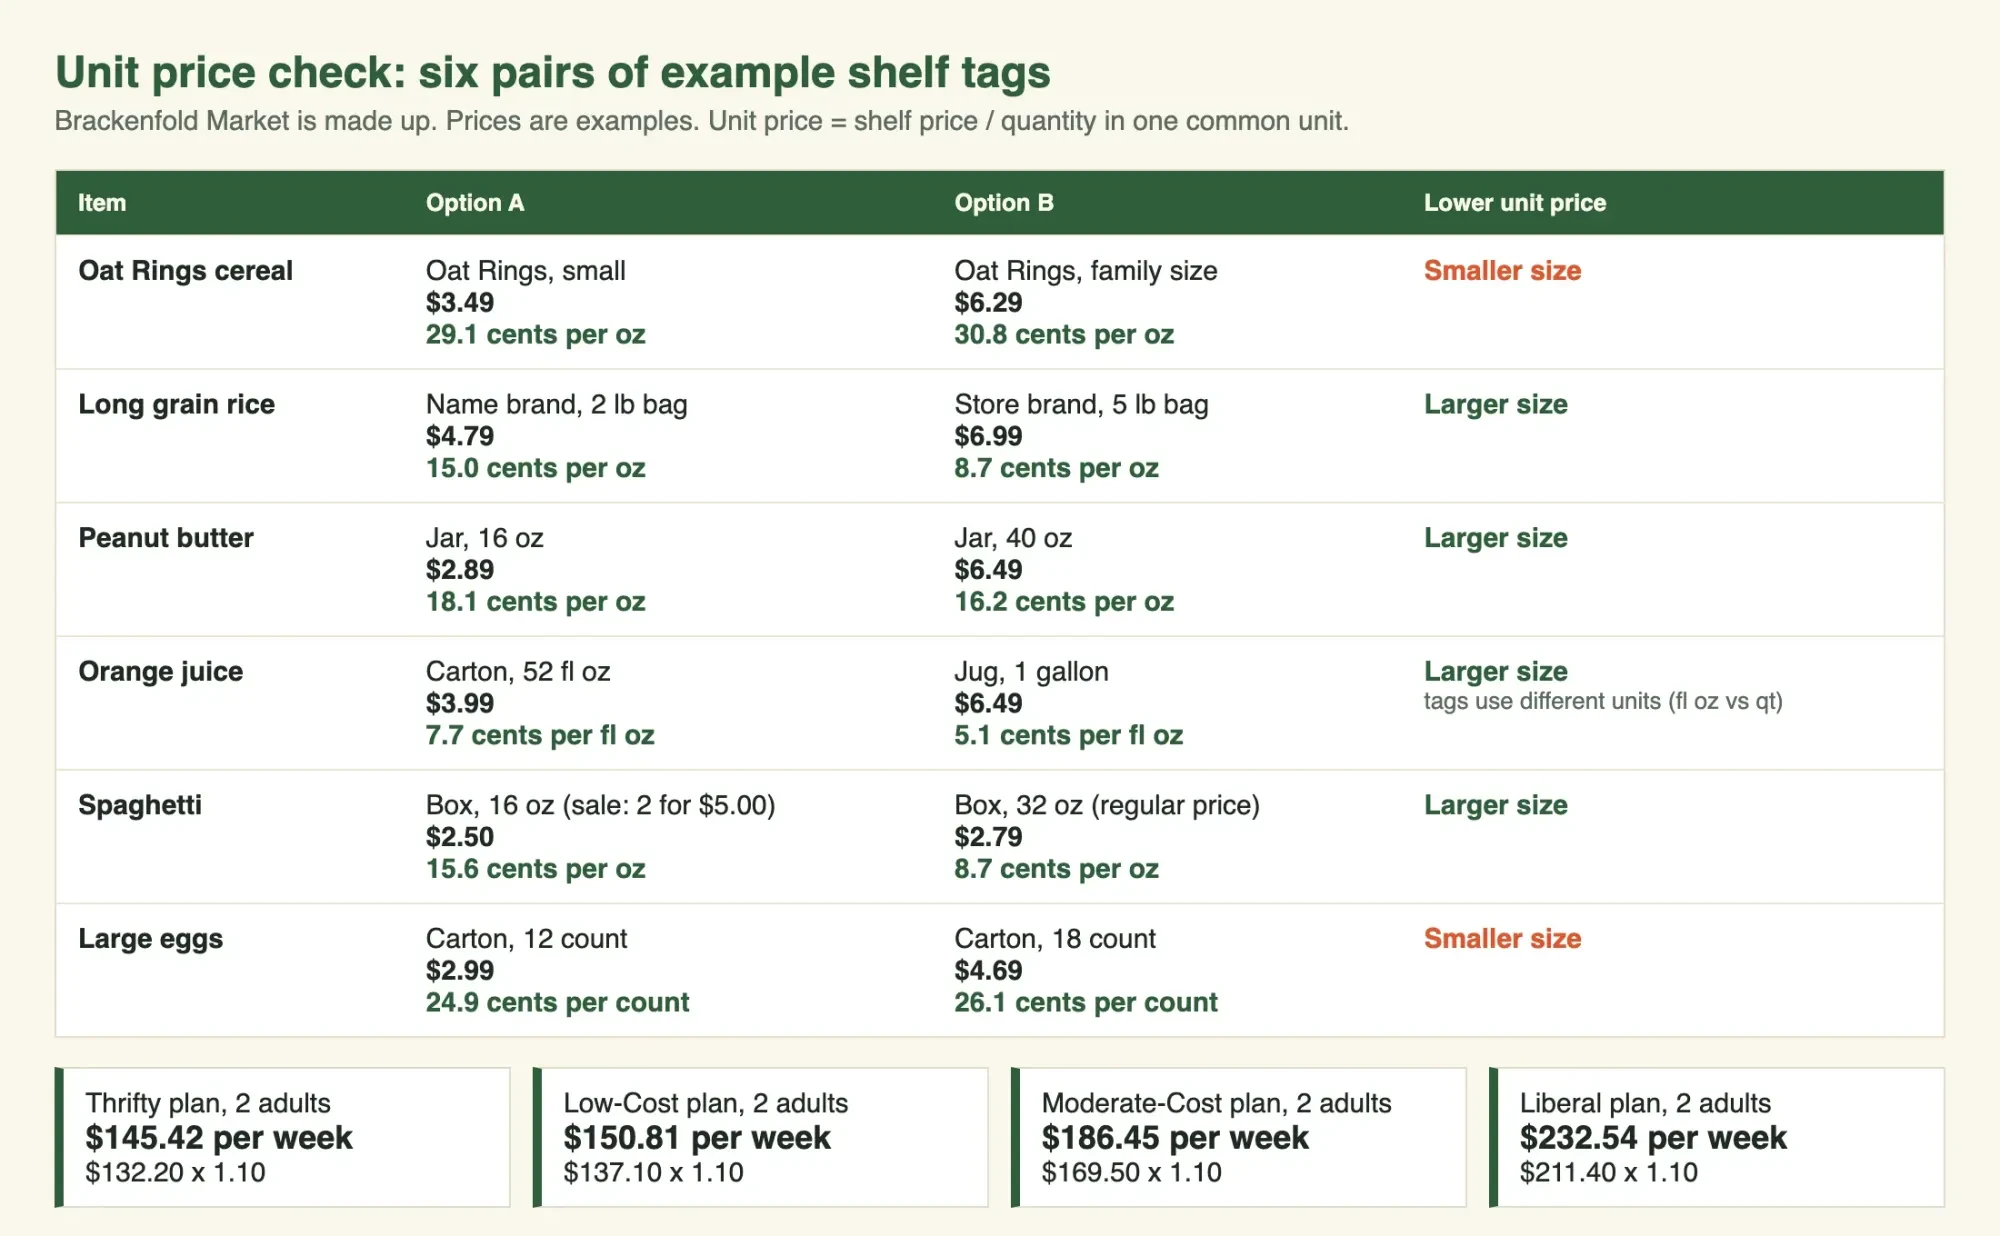 Screenshot: unit-price results for six example tag pairs and four USDA plan caps, served from localhost on October 30, 2026.
What we tested
We ran a local calculator on made-up tags on October 30, 2026. All six pairs are in the table above and the four caps in the cap table below. Its checks:
$ python3 unit_price.py
checks: six_pairs_priced=True, oat_rings_larger_costs_more=True, eggs_larger_costs_more=True, juice_units_converted=True, sale_box_costs_more_per_oz=True, thrifty_cap_matches_hand_math=True, receipts_under_cap=True
checks passed: 7 of 7
When tags use different units, or a sale sign hides the unit price
Those example tags all shared a unit within each pair, except one. In our example juice pair, the 52 fl oz carton was tagged per fluid ounce and the gallon jug per quart, so the two shelf numbers couldn't be compared. Under UUPR Section 6(a), a store pricing one product in two units "shall unit price the items consistently." Not every state uses that rule. NIST's retail pricing laws page names 10 jurisdictions with mandatory unit pricing. The same page lists 9 more with voluntary provisions. It also says "Thirty-three states have no unit pricing provisions in force," so outside the 10 a store can choose. It's worth checking your state.
Watch for odd units as well. A detergent tag priced per load can't be compared, since NIST's guide says "loads," "uses," and "servings" aren't acceptable units of measure. When units differ, convert both tags to the smaller unit. Here are the conversions from our test:
| Tag says | Convert to | Example (made-up prices) |
| per lb | divide by 16 for per oz | Rice, 5 lb at $6.99: $1.40 per lb = 8.7 cents per oz |
| per qt | divide by 32 for per fl oz | Juice, 1 gal at $6.49: $1.62 per qt = 5.1 cents per fl oz |
| per gal | divide by 128 for per fl oz | Same jug: $6.49 / 128 fl oz = 5.1 cents per fl oz |
| per fl oz | already the smaller unit | Juice, 52 fl oz at $3.99: 7.7 cents per fl oz |
Converted, the gallon wins at 5.1 cents a fluid ounce against 7.7. Unconverted, $1.62 per quart beside 7.7 cents makes the jug look like the dearer buy.
Sale signs cause the other mix-up. The big yellow number often has no unit price at all. NIST's 2025 guide says "Unit prices should be displayed on all sale signs (e.g., club card promotions, and digital coupon offers)" too. For a deal like "buy 2 for $2," it says the unit price "should be calculated and displayed based on each price." No unit price on the sign? Do the division yourself. Our example 16 oz spaghetti at 2 for $5.00 came to 15.6 cents an ounce, while the regular 32 oz box beside it came to 8.7 cents. The sale box was the pricier ounce.
Club and app prices follow the same division. An example $1.99 club price on the 16 oz spaghetti is 12.4 cents an ounce ($1.99 / 16), still above the 8.7 cents of the regular 32 oz box. Online carts are no different. NIST says unit pricing "can be displayed anywhere products are marketed."
Set a weekly cap from the USDA food plans
Once the shelf math picks the box, a cap tells you when the cart is full, and that number can come from a table USDA already publishes every month. USDA prices four food plans each month: Thrifty, Low-Cost, Moderate-Cost and Liberal.
The Thrifty Food Plan table for September 2026 lists $58.60 a week for a woman aged 20-50 and $73.60 for a man aged 20-50. The Low-Cost, Moderate-Cost and Liberal table uses a 19-50 age band for the same two people, so check the age column before you copy a number.
Those costs are per person in a four-person household, so smaller homes add a share. USDA's footnote says to add 20% for one person, 10% for two and 5% for three, and to subtract 5% for five or six. You total the people first, then adjust.
Take one adult. A single woman aged 20-50 on the Thrifty plan, for example, comes to $58.60 (September 2026) times 1.20, which is $70.32 a week. For our example household of two adults, aged 30 and 34, the weekly caps come out like this:
| USDA plan (September 2026) | Person 1 + person 2 | x 1.10 for two people | About a month (x 4.333) |
| Thrifty | $58.60 + $73.60 = $132.20 | $145.42 | $630.10 |
| Low-Cost | $63.80 + $73.30 = $137.10 | $150.81 | $653.46 |
| Moderate-Cost | $77.60 + $91.90 = $169.50 | $186.45 | $807.89 |
| Liberal | $99.10 + $112.30 = $211.40 | $232.54 | $1,007.60 |
Pick the row nearest to what your receipts say you spend now, not the row you hope to reach after a few months of practice. Say, as an example, you spend $190 a week and jump straight to the Thrifty row because it's the lowest number. That's a promise to cut almost a quarter of your food spending in one step. The Moderate-Cost row, at $186.45, is the closer start, and you can step down later. At $186.45 against $190, that first step's a cut of about 2% ($3.55 a week), small enough for a few unit-price swaps to cover. Our test used the Thrifty cap as its example, so the rest of this guide does too.
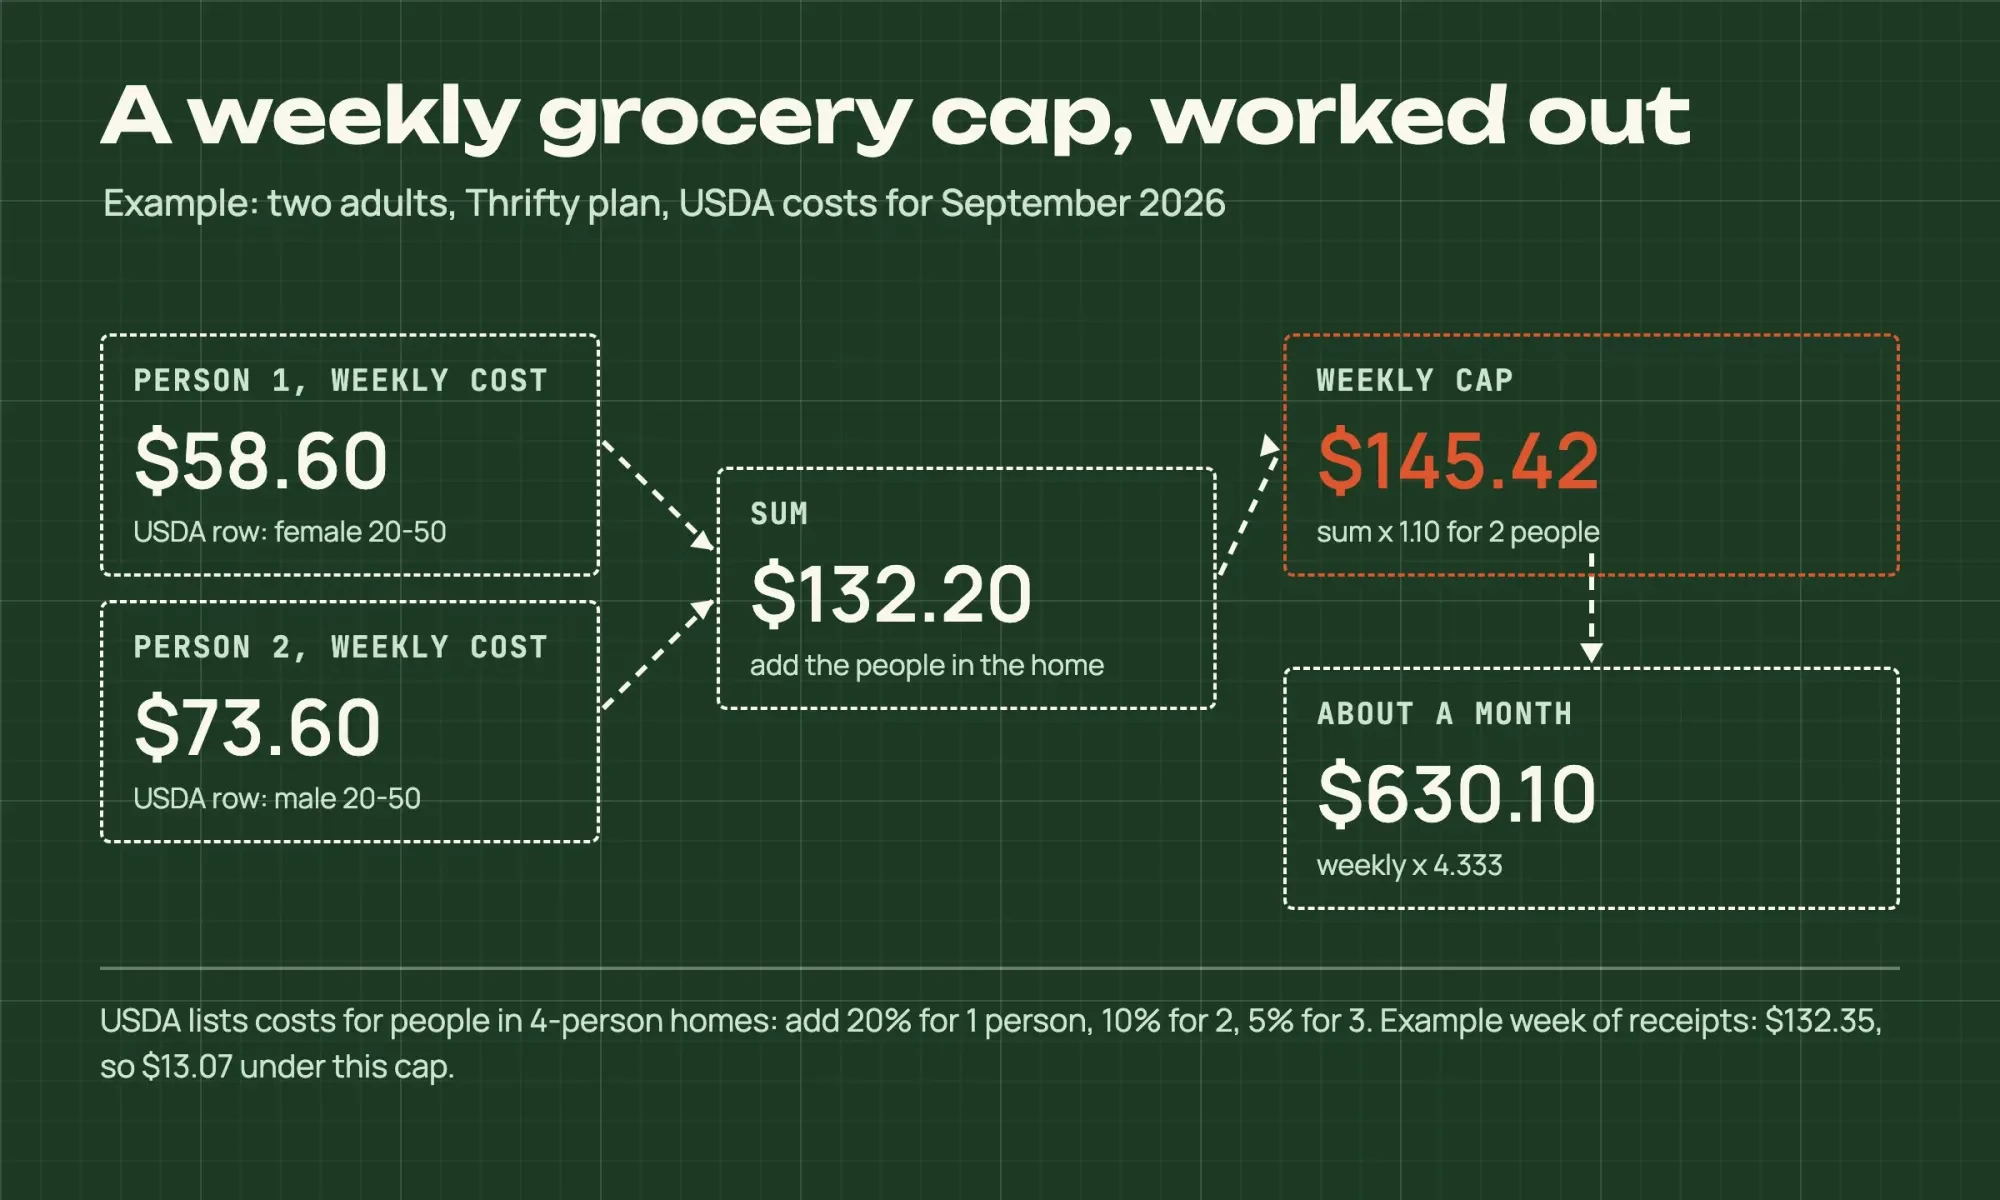 Diagram by DigitalTreed: the Thrifty cap for an example two-adult household, from the USDA September 2026 table and its household-size footnote.
Two footnotes matter, and they're easy to miss. The plans assume "all meals and snacks are prepared at home," so takeout needs its own line. And USDA gets a month by "multiplying the weekly costs by 4.333," not by four.
Keep the cap current as grocery prices move
That cap won't stay right forever, though lately the drift's been small. The Consumer Price Index for food at home is BLS's measure of grocery store prices. It stood at 321.758 in September 2026, against 316.042 a year earlier. That's a 1.8% rise, the same figure USDA's Food Price Outlook reports, and you can read the BLS food-at-home series free, with no account. Prices didn't move evenly, though. Over those 12 months, egg prices fell 20.6% and beef and veal rose 3.5%, per both the BLS index values and USDA's outlook. If eggs and beef fill your cart, your own total can move far more than 1.8% in either direction, so track your own receipts, not the national figure.
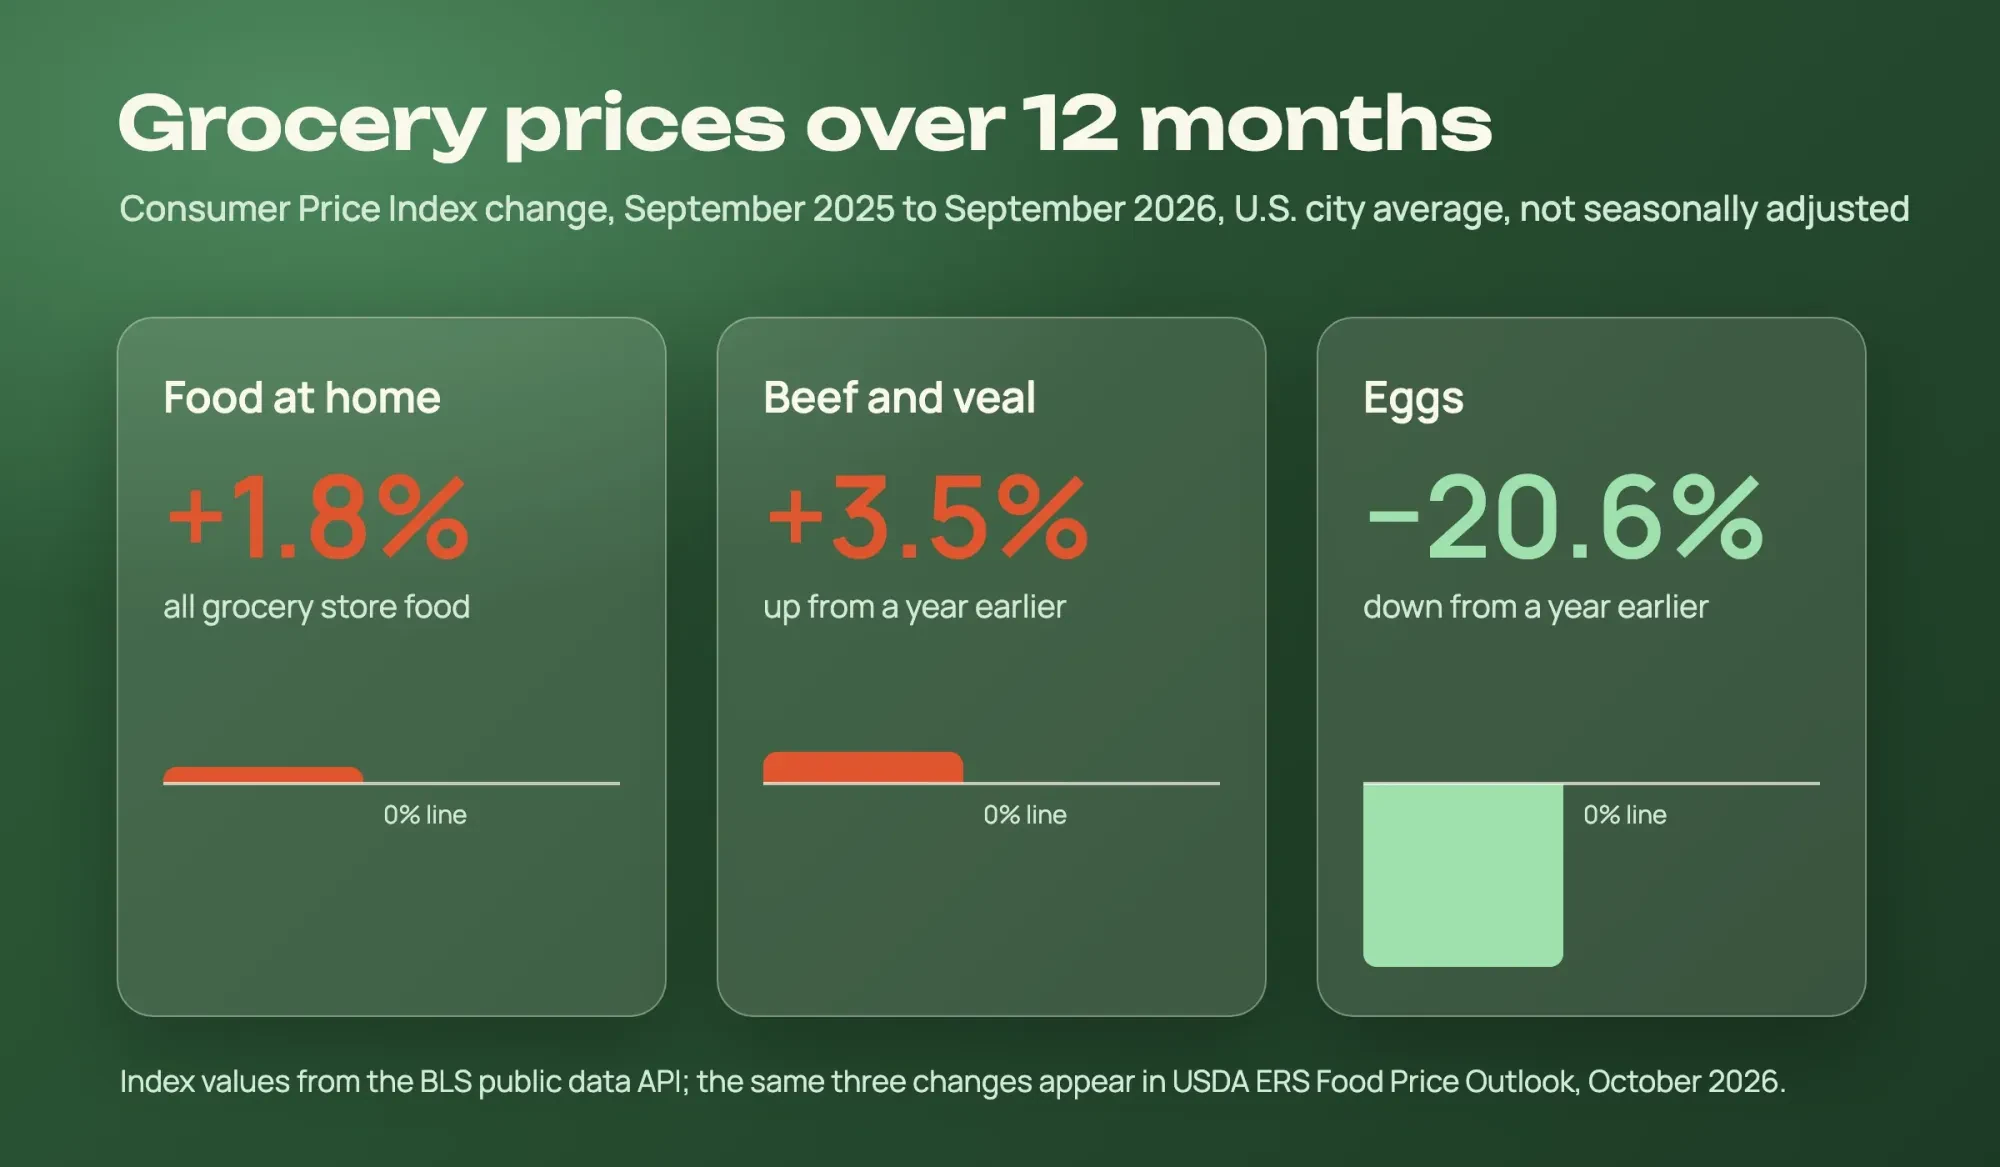 Source: BLS CPI index values (U.S. city average, not seasonally adjusted) and USDA ERS Food Price Outlook, October 2026; chart drawn by DigitalTreed.
USDA updates the plan costs monthly from those same price indexes, so a fresh table moves the cap for you without any math on your side. We'd look at the new table once a quarter and change the cap only when your household's row has moved by a few dollars either way.
Between updates, add up your receipts once a week. In our example week, three trips of $61.20, $48.75 and $22.40 came to $132.35, which left $13.07 under the $145.42 Thrifty cap.
Kept every week, that example $13.07 comes to $679.64 over 52 weeks ($13.07 x 52). Our fast money versus slow money math shows how small amounts add up. The CFPB's Your Money, Your Goals toolkit has a free spending tracker.
Checking receipts against the card statement also catches lines that don't match any trip. Say an example $22.40 run posts under a processor name such as FDMS instead of the store. Our guide to matching an unfamiliar FDMS charge shows how to find the shop before you dispute anything.
When the cap still doesn't cover food
Even the Thrifty row can be more than what's left after rent and bills. No unit price on any shelf fixes that gap. SNAP, the program once called food stamps, "can help you pay for food if you have a low income," says USA.gov's SNAP page. To apply, it says to "contact your state or local SNAP office." Your state's requirements, including income limits and the money in your bank, decide who qualifies. Once you're approved, USA.gov says, benefits land each month on an EBT card you'll use at the store. A SNAP household can also qualify for Lifeline, the federal phone discount, and our Lifeline and SNAP phone guide explains how that link works.
Groceries usually aren't the only bill when the cap breaks. Rent or a utility notice may be due the same week. Our financial emergency options guide puts the biller's hardship plan and local aid such as 211 ahead of borrowing.
Groceries on a card cost more once the balance carries past the due date, and our credit card financing explainer works out that interest. For a payday loan, our payday lender guide turns the fee into an APR so you can compare the two costs.
Last, a tag that looks wrong, or a shelf with no unit prices? NIST's list of state weights and measures directors shows who can say what your state requires. Our own order would be to set the cap from the September table, total the receipts every Sunday, and let unit prices decide what fits under it.
Grocery budget questions
Frequently asked
Why do some items have no unit price on the tag?
The model rule exempts packages under 1 oz or 1 fl oz, items priced 50 cents or less, and one-brand, one-size products (UUPR Section 3).
How does USDA keep the food plan costs current?
The Thrifty plan is built on "2013-16 consumption and 2015-16 price data," and the other three plans on "2001-02 data." Each is "updated to current dollars by using the Consumer Price Index for specific food items." That's from the footnotes to the September 2026 three-level table and the September 2026 Thrifty table.
Is the Thrifty plan the same as a SNAP amount?
No. USDA's Thrifty reference family of four is a man and a woman aged 20-50 and two children aged 6-8 and 9-11. It cost $236.30 a week in the September 2026 table, and it "is used to determine the maximum Supplemental Nutrition Assistance Program (SNAP) allotment."
How much will grocery prices rise in 2026?
"In 2026, food-at-home prices are forecast to increase 2.3%, with a forecast interval of 1.9 to 2.7%," says USDA's Food Price Outlook (updated October 23, 2026).
How we made this guide: The cap numbers come from USDA's two September 2026 cost-of-food tables and the shelf rules from NIST. A local script did every sum on made-up tags. Facts checked by the DigitalTreed team on October 30, 2026.
First published April 2025 as ten general shopping tips with no sources. Rewritten October 30, 2026: it now sets a USDA-based weekly cap, tests six example tag pairs and adds September 2026 price changes.
Sources
- USDA: Cost of Food monthly reports (index page)
- USDA: Official Thrifty Food Plan, U.S. average, September 2026 (PDF)
- USDA: Official Food Plans at three levels, U.S. average, September 2026 (PDF)
- NIST SP 1181: Unit Pricing Guide, June 2025 (PDF)
- NIST Handbook 130 (2026): Uniform Unit Pricing Regulation (PDF)
- NIST: US Retail Pricing Laws and Regulations
- NIST: State Weights and Measures Directors
- GovInfo: 15 U.S.C. 1451, Fair Packaging and Labeling Act policy
- BLS: CPI food at home, U.S. city average (CUUR0000SAF11)
- USDA ERS: Food Price Outlook, summary findings, October 2026
- USA.gov: How to apply for food stamps (SNAP benefits)
- CFPB: Your Money, Your Goals toolkit


Comments
No comments yet. Start the conversation below.