


Quick answer
A VPS removes the per-account caps that cut a shared site off mid-spike. CloudLinux's documented default, as of November 2026, is 20 entry processes, and the next request gets a 508 error. If a page cache serves most visits, those caps may never bite. Ask your host for your limit faults first, then size a VPS with the formulas below.
How VPS hosting helps growing websites handle traffic spikes comes down to who sets the limits. Say your sale email goes out at 9 a.m., and by 9:05 shoppers see "Resource Limit Reached" instead of the product page. A VPS, or virtual private server, is a virtual machine with its own share of CPU and memory. You set its worker limits.
We tested the queue on one 10-core Mac desktop at 127.0.0.1, which isn't a web host, so its numbers are a model, not a benchmark. With 3 PHP processes and 40 requests at once, the median page took 2,035 ms, against 158 ms for a lone visitor. A static cached copy served 25,863 pages a second on that machine. So a page cache is the first fix to try, and a VPS sized by formula, with its monthly costs, comes after it.
Key takeaways
- A 508 page on shared hosting usually means the entry-process cap was hit.
- CloudLinux's default caps an account at 20 dynamic requests at once.
- Turn on a page cache before paying for a bigger server.
- PHP workers equal uncached requests a second times seconds, plus 50% headroom.
- As of November 2026, two vendors list a 4 GB VPS at $24 monthly.
Why does shared hosting return a 508 during a spike?
That 508 comes from the limits software, not from the physical server. Hosts that run CloudLinux put each account in its own lightweight virtual environment, or LVE, with fixed caps on CPU, memory, disk and processes. The CloudLinux limits documentation lists the defaults as of November 2026, and its "Typical Hosting Account" gets SPEED=100%, PMEM=1GB, NPROC=100 and EP=20. It's EP, short for entry processes, that turns a spike into an error page, and the docs say EP "Usually represents max number of concurrent connections to apache dynamic scripts". Past that number, the server sends an "error 508 page ( Resource Limit Reached )" to everyone else.
Since EP counts dynamic scripts, the cart and checkout pages, which run PHP on every visit, are the first to break.
Your host may have changed these defaults, since each host sets its own values, but the symptom tied to each cap doesn't change.
| Limit | CloudLinux default | What a visitor sees when it is hit |
|---|---|---|
| SPEED (CPU) | 100% of one core | Pages respond slower |
| PMEM (memory) | 1 GB | 500 or 503 errors |
| IO (disk throughput) | 1,024 KB/s | Processes are throttled |
| IOPS | 1,024 a second | Reads and writes pause until the second ends |
| NPROC (processes) | 100 | 500 or 503 errors |
| EP (entry processes) | 20 | 508 Resource Limit Reached page |
CloudLinux says a site held back by CPU or IO "will start responding slower," while one held back by memory or process count gets "500 or 503 errors." So a slow site, a 503 and a 508 during one sale can all trace back to your account's caps, not to a broken plugin.
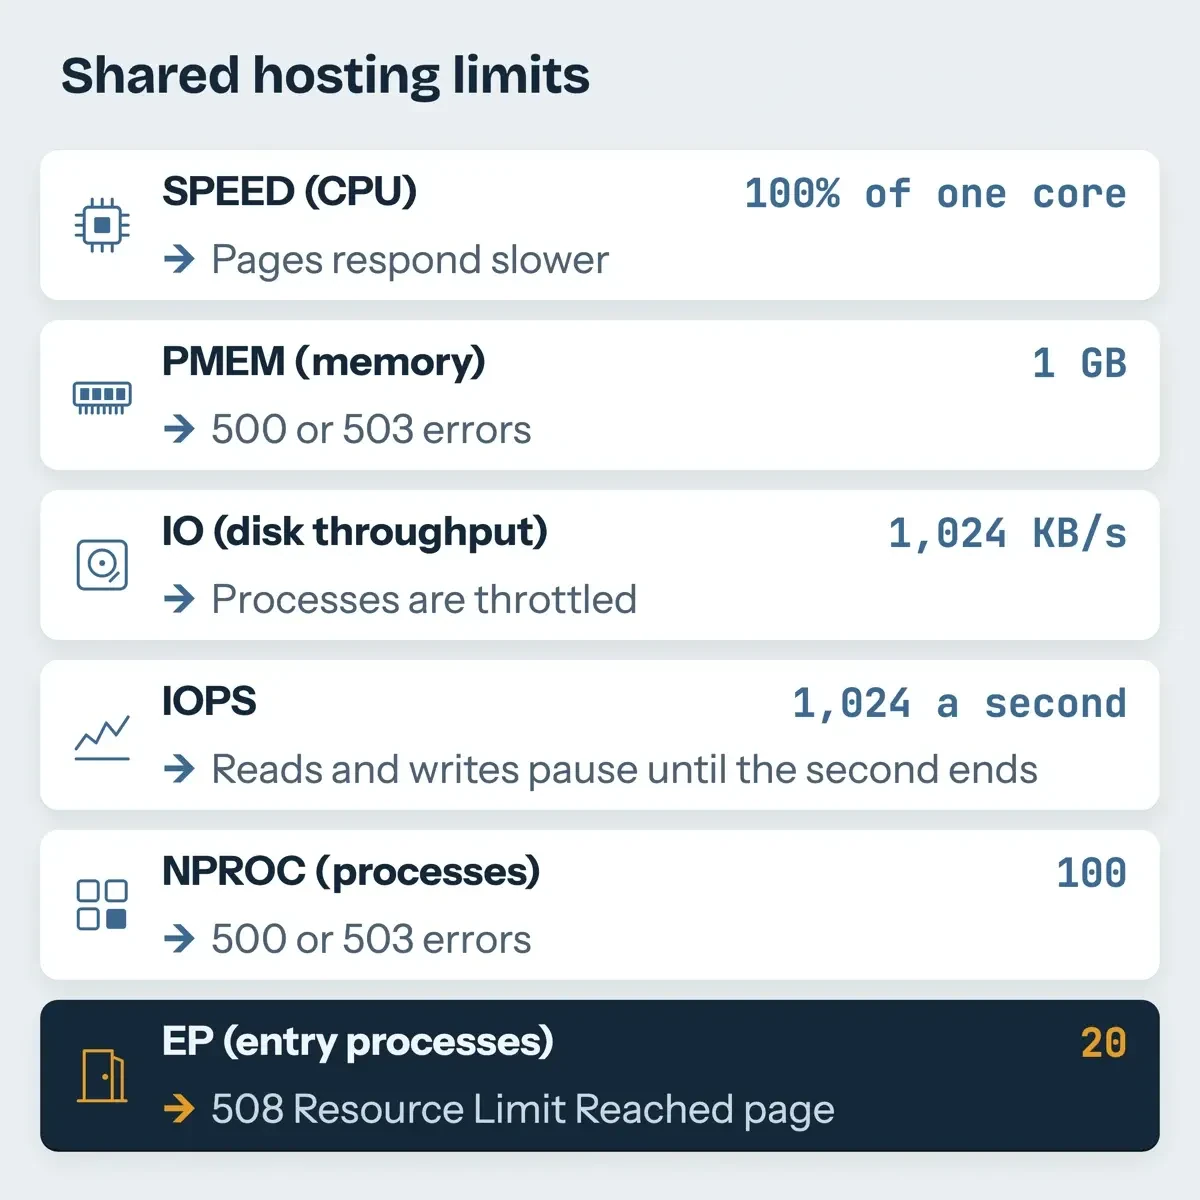 Diagram by DigitalTreed, from the CloudLinux limits documentation read November 13, 2026.
Get the record of which cap you hit before you move anything. CloudLinux's LVE Manager documentation shows hosts can track "LVE Faults" per account and email them. A fault is one time a limit was hit. Ask support for your EP, NPROC and PMEM values and for the fault count during the hour of the spike. If your host doesn't run CloudLinux at all, check your server's access log. It lists each 500 or 503 response with its time, and WordPress error logs show the PHP errors behind them. Match those times to the sale email.
Queueing: why pages slow before errors start
Long before a 508, requests wait in line for a free PHP worker, and that wait grows with every visitor who arrives while they're all busy. A server can't finish more uncached pages a second than its workers divided by the seconds each page takes. In our test on one Mac at 127.0.0.1, three workers that needed 0.158 seconds per page topped out near 19 pages a second. That's 3 / 0.158 = 19.0. Send 40 requests at once and each one waits about 40 / 19 = 2.1 seconds before it's done. Past that point, more visitors can't raise throughput; they only make the line longer.
What we tested
We ran a load test on November 13, 2026, on 127.0.0.1 only, on one 10-core Mac desktop with PHP 8.3.35's built-in server and ApacheBench 2.3. Our made-up page waits 150 ms to stand in for PHP and database work, and a static copy stands in for a page cache. These are one machine's numbers and aren't a benchmark of any host.
What 40 requests at once did to our local test server
We changed one thing at a time: worker count, a 20-request gate, then the cached copy. A warm-up run with 1 worker and 1 request at a time came first. It measured 158 ms per page.
| Setup (one Mac, 127.0.0.1) | Requests at once | Pages a second | 95% served within | Errors |
|---|---|---|---|---|
| 2-worker setting (3 PHP processes) | 10 | 19.19 | 610 ms | 0 |
| 2-worker setting (3 PHP processes) | 40 | 19.22 | 2,195 ms | 0 |
| Same, behind our 20-request gate | 10 | 19.22 | 609 ms | 0 |
| Same, behind our 20-request gate | 40 | not comparable | not comparable | 379 of 400 |
| 8-worker setting (9 PHP processes) | 10 | 54.23 | 307 ms | 0 |
| 8-worker setting (9 PHP processes) | 40 | 56.52 | 770 ms | 0 |
| Static cached file, 2-worker setting | 40 | 25,863 | 3 ms | 0 |
The worker setting of 2 started 3 PHP processes on our machine, and the setting of 8 started 9, so we used process counts in the math. Our formula predicted 19.0 and 57.0 pages a second, and we measured 19.19 to 19.22 pages a second with 3 processes and 54.23 to 56.52 with 9. On this one machine, the formula landed within about 5% of every run, so that's the formula the example sizing below uses. At 40 requests at once with 3 processes, the median page took 2,035 ms and the slowest took 5,030 ms (2,143 ms in a rerun the same day). Nothing failed. Still, that median is 13 times the 158 ms one visitor waited alone.
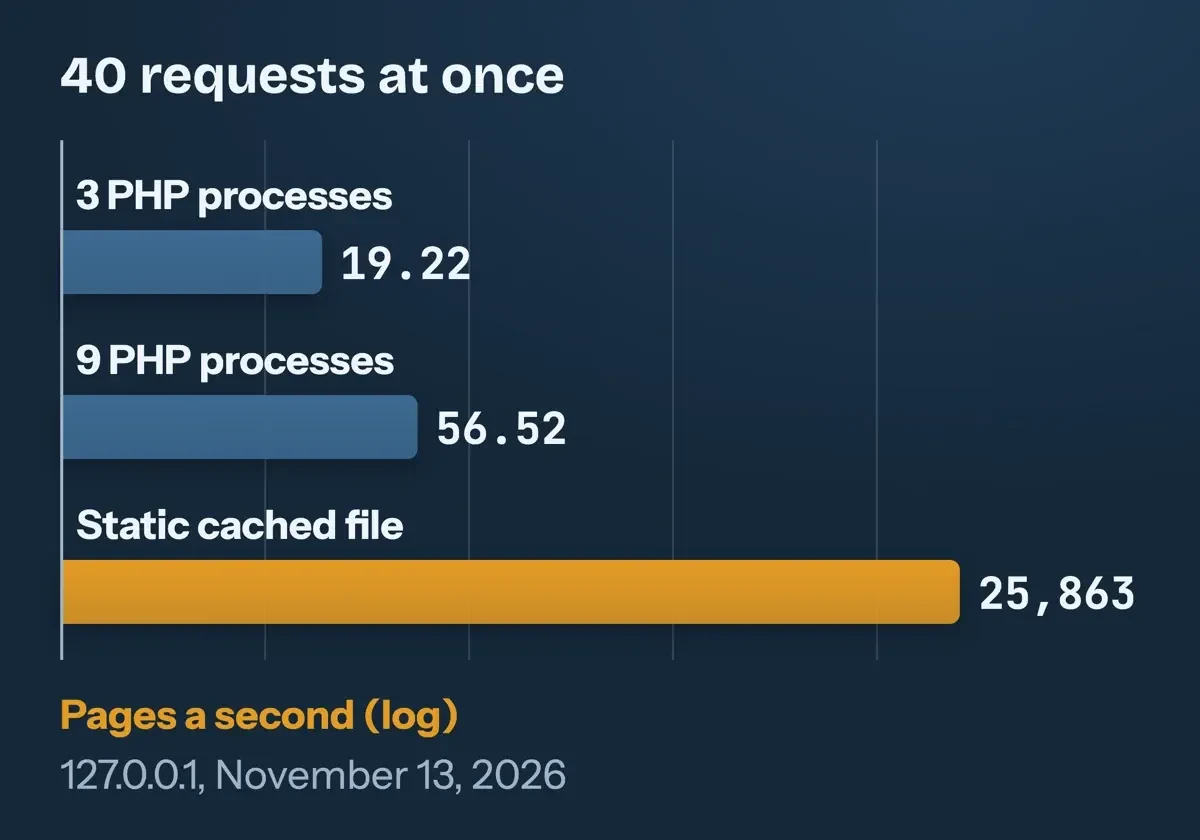 Drawn by us from our load test on one Mac at 127.0.0.1, November 13, 2026.
Next we added our own gate, a few lines of Python that answer 508 once 20 requests are in flight, copying the CloudLinux rule rather than its code. The real limit "may differ depending on the web server," CloudLinux notes, so a LiteSpeed host can count it another way. At 10 requests at once, nothing changed. At 40, 379 of 400 requests got the 508 page within 1.231 seconds, and only 21 got the real page. Don't read that run's pages-a-second figure as speed, though. ApacheBench sends a new request the moment one finishes, so instant error pages got fetched over and over again.
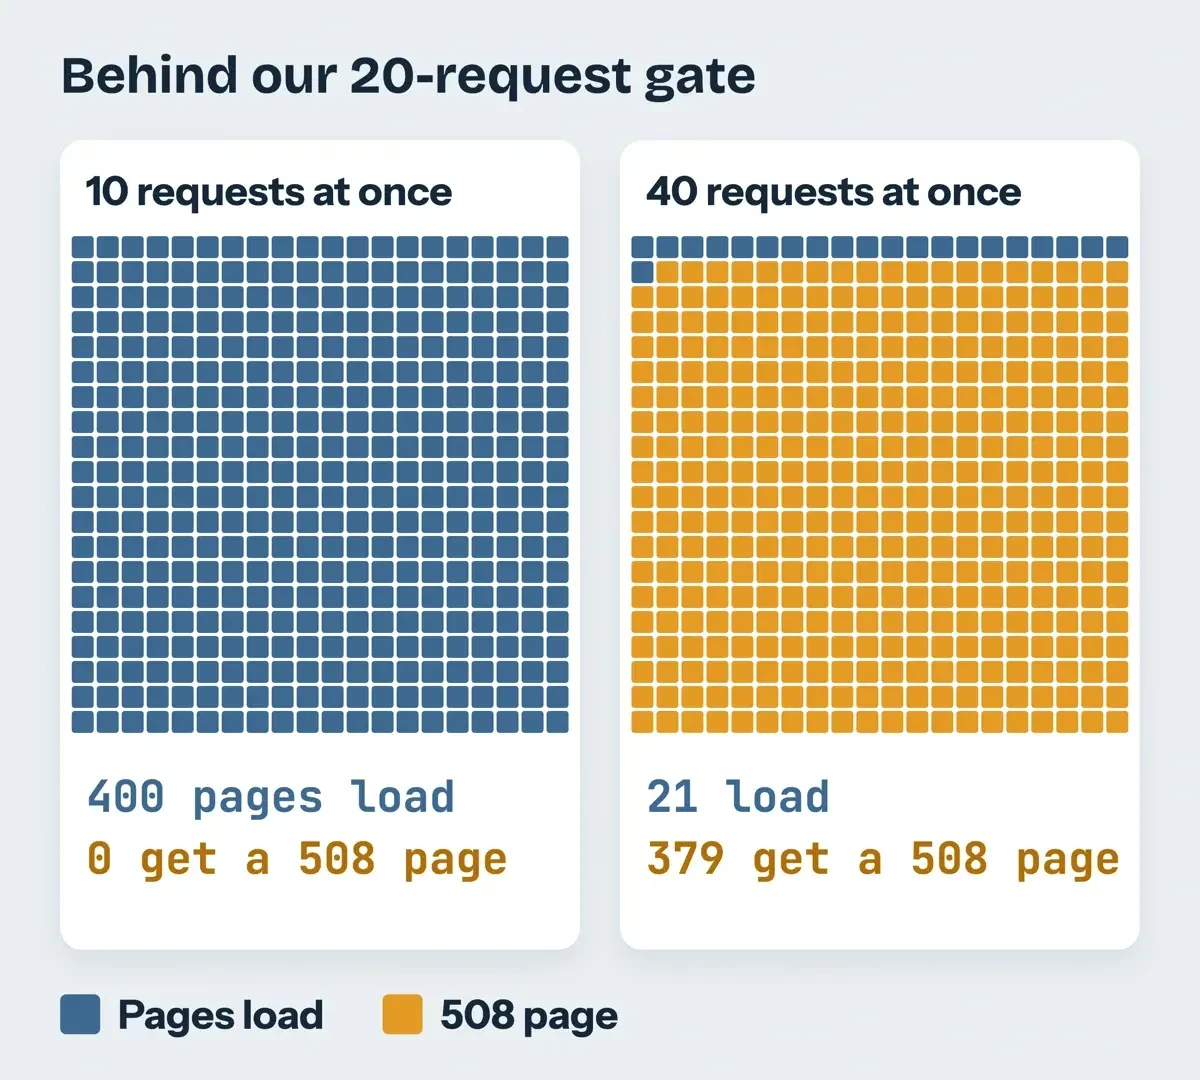 Drawn by us from our 20-request gate test on 127.0.0.1, November 13, 2026.
Both tools carry warnings of their own. PHP's built-in web server page says it "is not intended for production usage," and the ApacheBench manual says ab "does not implement HTTP/1.x fully." So the table shows how a queue builds on one machine, not how many pages your host would serve.
Caching before you resize
On our one-Mac test at 127.0.0.1, that static copy served 25,863 pages a second without touching PHP, against about 19 for the PHP page on the same 3 processes. A page cache does that job on a real site: a visitor who gets the saved file never waits for a worker.
WordPress's caching handbook calls caching "the fastest way to improve performance" and says cache plugins save pages "as static files." On WordPress that means a page cache plugin, or a cache your host runs on the server for you. Cart and login pages still run PHP on every visit, though, so they're uncached in the sizing math. A CDN doesn't fix this on its own. Cloudflare's default cache behavior page says, "The Cloudflare CDN does not cache HTML or JSON by default." It'll cache your images and CSS, but each page view still reaches your server until you've added a cache rule for HTML.
Our HTTP header checker shows whether a page carries a cache status header. Run it on a product page, then on the cart, which runs PHP on every visit.
If you run nginx yourself, two of its cache settings deal with a crowd hitting one page. The nginx FastCGI module docs say that with fastcgi_cache_lock on, "only one request at a time will be allowed to populate a new cache element." The fastcgi_cache_use_stale setting can serve the old copy while PHP returns a 500 or 503. A crowd then sees a slightly older page, not an error.
How VPS hosting helps growing websites handle traffic spikes
Unlike a shared account, a VPS has no LVE around it, and you pick the PHP worker count. The PHP-FPM configuration manual says that with pm set to static, "the number of child processes is fixed ( pm.max_children )." That's the worker number from our test, and on a VPS it's yours to set. Requests that arrive while every worker's busy wait in a queue instead of getting a 508, and the same manual puts PHP-FPM's listen.backlog default at 511 on Linux. The database has its own ceiling, too. MySQL's max_connections setting defaults to 151, "The maximum permitted number of simultaneous client connections."
In exchange, the server's now your job. On an unmanaged VPS you patch the operating system, PHP and the database yourself, and you watch for outages with something like our uptime monitoring setup. If you'd rather skip that work, a managed VPS or a shared tier with a higher EP may suit you better. Our cloud computing architecture guide compares shared, VPS and cloud setups. CloudLinux's own High End example doubles EP to 40.
Sizing a VPS: workers, vCPUs and RAM
A VPS that's too small queues and fails the same way, so size it with the four formulas in the table below. The inputs below aren't measurements. They're an example for a made-up store. Swap in figures from your own analytics, access logs and server before you buy. Our example store peaks at 40 page views a second, with 75% served from cache, and 0.4 seconds per uncached page, 0.12 of it CPU time. Workers get 1.5 times headroom, and the CPU target is 70% busy.
| What to size | Formula | Example inputs | Example result |
|---|---|---|---|
| Uncached requests a second | peak page views x (1 - cache hit share) | 40 x (1 - 0.75) | 10 |
| PHP workers (pm.max_children) | uncached rps x seconds per request x 1.5 | 10 x 0.4 x 1.5 | 6 |
| vCPUs | uncached rps x CPU seconds per request / 0.7 | 10 x 0.12 / 0.7 = 1.71 | 2 |
| RAM | workers x MB per worker + database + OS | 6 x 80 + 1,024 + 512 | 2,016 MB, so a 4 GB plan |
In this example, 6 PHP workers, 2 vCPUs and a 4 GB plan cover the peak, with 2,016 MB planned and the rest left for cache in memory. The 80 MB per worker is only a placeholder, so measure yours with ps on the running server and redo the RAM line.
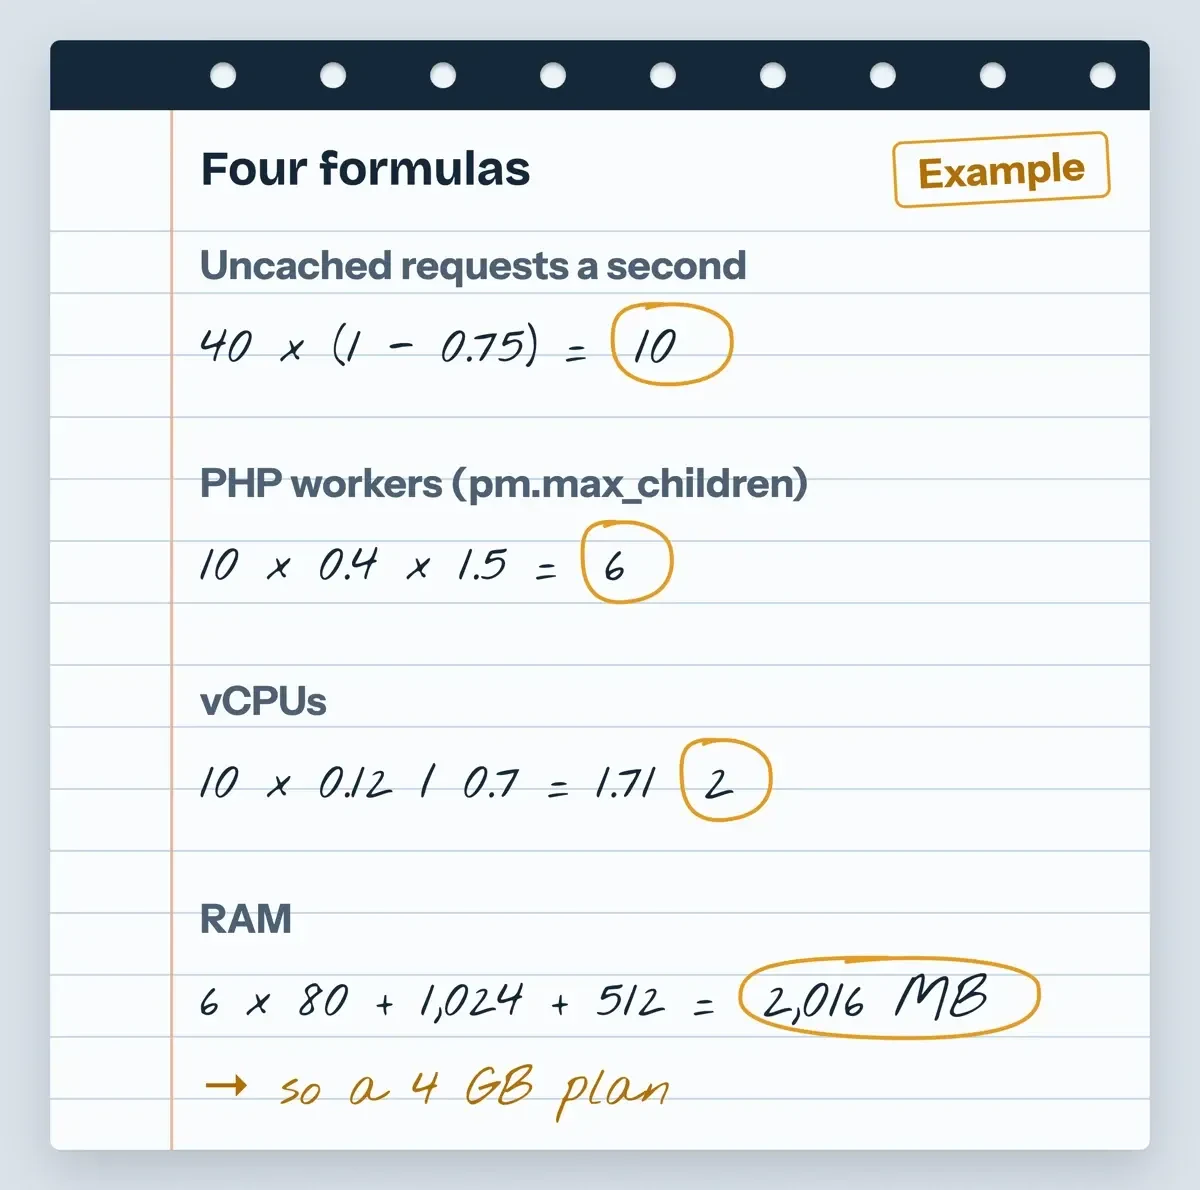 Drawn by us: an example sizing worksheet with made-up inputs.
The formulas need seven numbers, and you'll get most of them from your own tools or your host:
- Peak page views a second, from your analytics, for the busiest minute
- Cache hit share, from your cache plugin or CDN stats
- Seconds per uncached page, from your server access log
- CPU seconds per uncached page, from a profiler or top during a test
- Memory per PHP worker in MB, from ps on the running server
- Database memory you plan to give MySQL or MariaDB
- Your host's EP, NPROC and PMEM limits and fault counts
If you can only get one of them, get the fault counts. A site that never hit EP or NPROC during its spike has mostly a slow-page problem, and a move alone won't fix it. Caching or a database fix will likely do more. Our guides to the database connection error and the Redis connection error cover two failures that also show up under load.
What a 4 GB VPS costs in USD
That example landed on 4 GB and 2 vCPUs, a size two vendors list at the same monthly price on their own US-dollar pages, read November 13, 2026. Tax and add-ons aren't included.
| Plan | Memory | vCPUs | Disk | List price (as of November 2026) |
|---|---|---|---|---|
| DigitalOcean Basic Droplet (Regular) | 4 GiB | 2 | 80 GiB | $24.00 a month |
| DigitalOcean Basic Droplet (Regular) | 8 GiB | 4 | 160 GiB | $48.00 a month |
| Amazon Lightsail Linux, public IPv4 | 4 GB | 2 | 80 GB SSD | $24 a month |
| Amazon Lightsail Linux, public IPv4 | 8 GB | 2 | 160 GB SSD | $44 a month |
DigitalOcean's Droplet pricing page lists the Basic 4 GiB plan at $24.00 a month as of November 2026. It calls Basic plans "ideal for bursty applications that can handle variable levels of CPU."
Amazon Lightsail's pricing page lists 4 GB with 2 vCPUs at $24 a month as of November 2026. A footnote on its smaller plans adds, "Virtual servers created on or before June 29, 2023 have 1 vCPU."
Neither price covers the time you'll spend on updates. Check the checkout total, then time one product page in our speed test tool before and after the move.
What the docs confirm, and what only your host can tell you
On November 13, 2026, we read every outside page linked here and saved a text copy. The CloudLinux defaults and the 508, 503 and 500 behavior were there, as were the PHP-FPM and MySQL defaults, the nginx and Cloudflare cache rules, and both vendors' prices. Some things we couldn't confirm. Akamai's Linode pricing page blocked our script with a 403 error, and Vultr's didn't answer, so neither is in the price table. Your host's own EP, NPROC and PMEM values aren't on the CloudLinux page, since each host sets them. Our load test ran on one Mac desktop at 127.0.0.1, which isn't a host. We didn't test a real shared account, a real VPS or WordPress memory per worker.
That leaves three checks for you: your limits and fault counts from support, memory per worker from your server, and the checkout price. Seeing 502s instead of 508s? Our 502 bad gateway guide covers that path, and a plain 500 with no limit hit points to the 500 internal server error guide. To hand the move to someone else, ask for a quote on our web development page.
Frequently asked
Will a CDN stop a traffic spike from reaching my server?
Only for what it caches. Cloudflare won't cache a response when "The Set-Cookie header exists," so cart and login pages still reach you.
Do 503 errors during a spike hurt Google rankings?
They slow crawling. Google's crawling docs say indexed URLs that keep returning server errors are "eventually dropped."
Is it a traffic spike or a DDoS attack?
CISA's DDoS guide, published March 21, 2024, names volumetric, protocol and application attacks. Call your host when traffic doesn't match anything you sent.
Is 508 an official HTTP error code?
Not for this use. IANA lists 508 as "Loop Detected" from RFC 5842. The standard overload code is 503 in RFC 9110.
How we made this guide: We saved the source pages as text and ran a load test on one Mac desktop at 127.0.0.1. Facts checked by the DigitalTreed team on November 13, 2026.
First published May 29, 2026. Rewritten November 13, 2026 for US readers with sourced limits, a local load test and a sizing formula.
Sources
- CloudLinux OS documentation: Limits
- CloudLinux OS documentation: CloudLinux Manager (LVE Manager)
- RFC 9110: HTTP Semantics, 503 Service Unavailable
- IANA: Hypertext Transfer Protocol (HTTP) Status Code Registry
- Google Search Central: How HTTP status codes affect crawling
- CISA: Understanding and Responding to Distributed Denial-of-Service Attacks
- PHP Manual: FPM configuration
- PHP Manual: Built-in web server
- Apache HTTP Server: ab, the benchmarking tool
- MySQL 8.4 Reference Manual: max_connections
- nginx: ngx_http_fastcgi_module
- WordPress Advanced Administration Handbook: Cache
- Cloudflare Docs: Default cache behavior
- DigitalOcean: Droplet pricing
- Amazon Lightsail: Pricing


Comments
No comments yet. Start the conversation below.